
5 Most Powerful Bearish Candlestick Patterns
After reading about the basics of candlestick chart patterns, we will focus on Bearish candlestick patterns which usually indicate the end of an uptrend in the markets and the start of a downtrend.
There are different types of bearish candlestick patterns some are single candle patterns whereas some are multiple candlestick patterns.
There are several things to be kept in mind:
- Bearish Candlestick patterns should be formed at the end of an uptrend, or it will only continue the ongoing uptrend of the markets.
- These bearish candlestick patterns should be confirmed with some major indicators like Volume or Support & Resistance.
In this article today we will be discussing about 5 Most Powerful Bearish candlestick patterns.
You can read our brief blog on the 5 Most Powerful Bullish Candlestick Patterns.
1. Hanging Man
Hanging Man’s candlestick pattern comprises a long lower shadow and a small real body. This candle should appear at the end of an uptrend to perform well. This bearish candlestick pattern indicates weakness in the ongoing price movement and indicates that the bulls have pushed the price up but can’t move further.
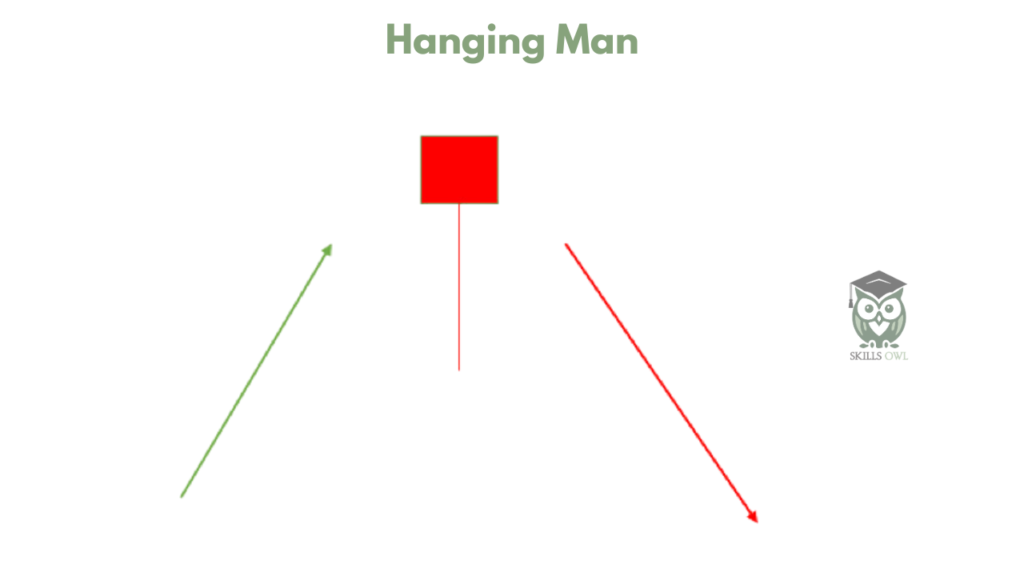
This candle pattern has a small real body which shows a small price difference in the opening & closing of the candle. To make its identity more clear it should have no upper shadow and a lower shadow with a length more than twice of its body. The formation of this candle signals the traders to close their long position and enter or create a new short position.
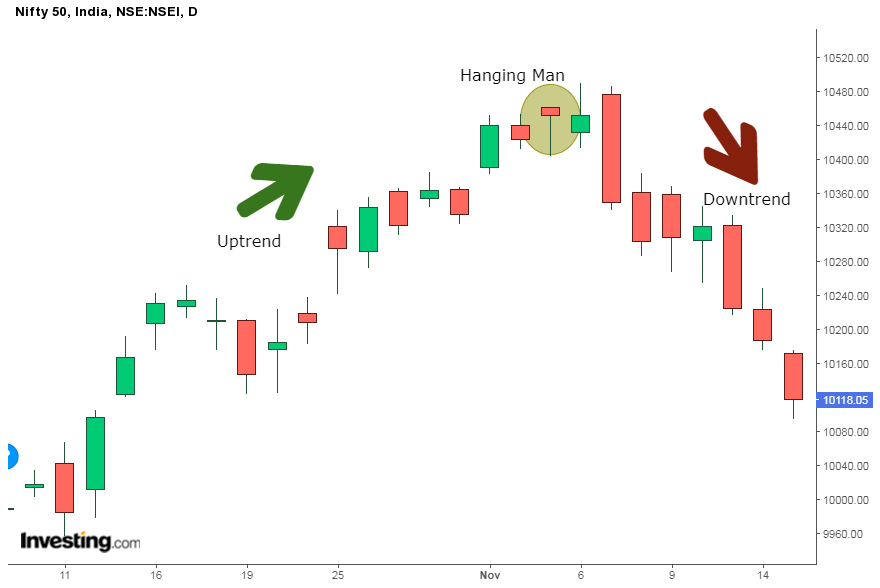
Here is an example of Hanging Man on a daily chart of Nifty 50.
2. Dark Cloud Cover
Dark Cloud Cover is a candlestick pattern that is formed at the end of the uptrend and generally signifies a loss of momentum in the uptrend.
Dark cloud cover is comprised of two candlesticks, the first one is bullish and the following candle is bearish in nature. This pattern becomes important for the reversal to the downside.
Example of Dark Cloud Cover in the charts of Sun Pharmaceuticals :
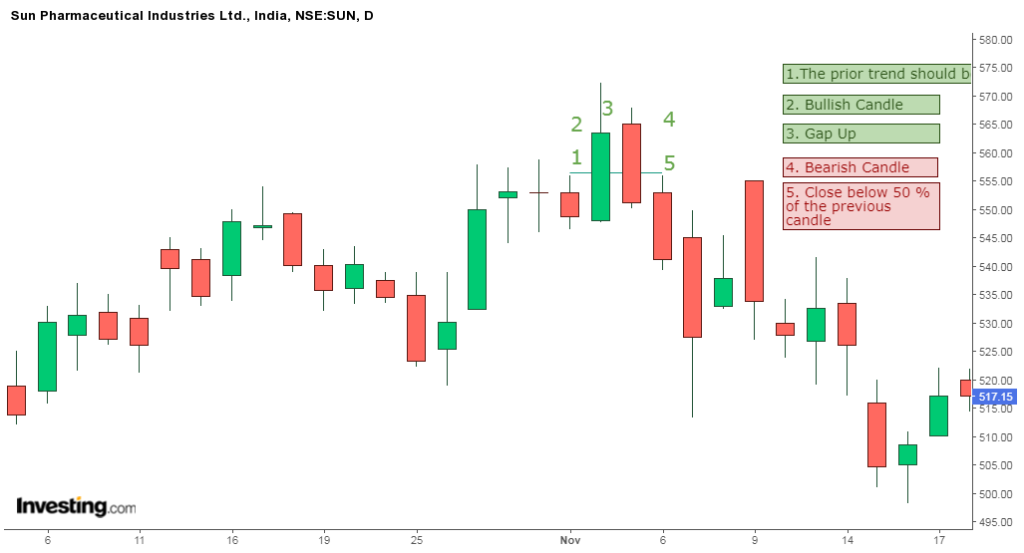
Dark cloud cover is an important bearish candlestick pattern that is traded mostly by traders because it is formed at the resistance and has a high chances of reversal when it is formed.
3. Bearish Engulfing – Most used Bearish Candlestick Patterns
A bearish engulfing candlestick pattern is generally formed by the selling pressure exerted by the sellers at the resistance zone on the charts. This pattern indicates a fall in the price and also the start of the bearish momentum in the markets.
This pattern triggers a reversal of the uptrend as selling pressure is increased while time passes in the markets.
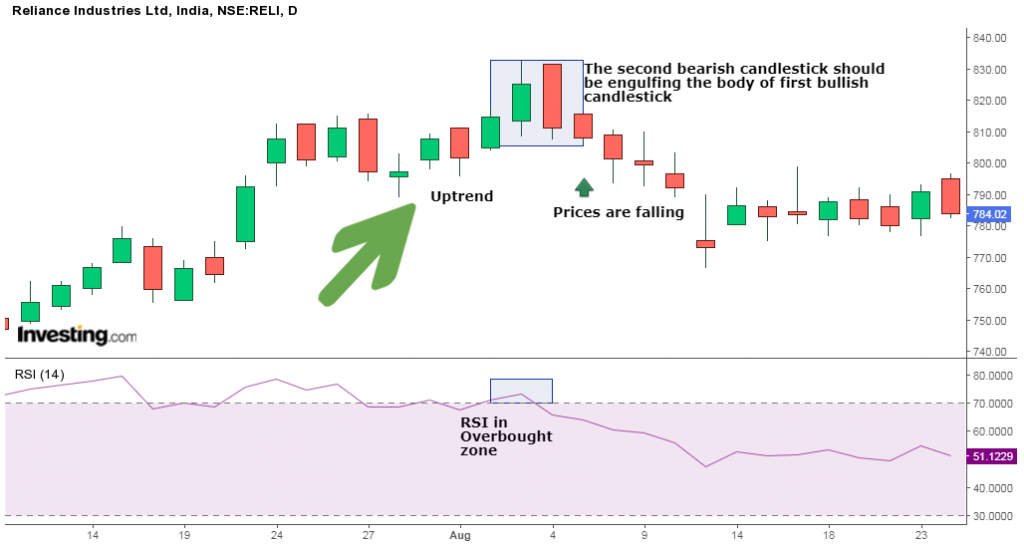
The pattern is formed by two candles with the second bearish candle engulfing the ‘body’ of the previous green candle.
Example of Bearish Engulfing pattern as shown in the charts of Reliance Industries on a daily timeframe:
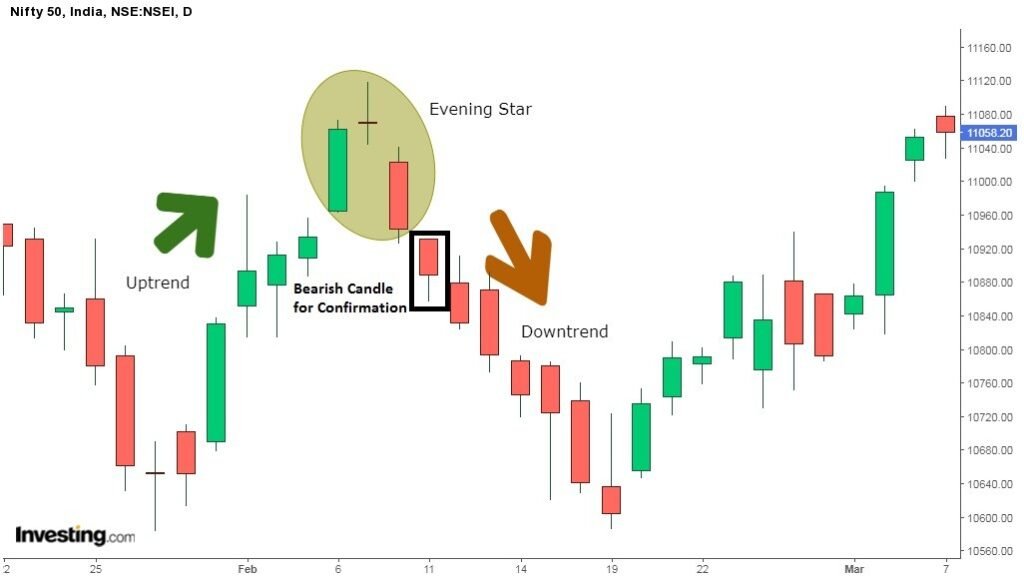
4. The Evening Star
The evening star is a candlestick pattern that is used by technical analysts for analyzing trends and their probable reversals. Three main candlestick patterns form this chart pattern, a large bullish candlestick, a small-bodied candle, and a bearish candlestick.
Evening Star pattern appears at the top of an uptrend and signifies a strong reversal and a start of a downtrend.
Example of the Evening Star pattern formed in the Nifty 50 chart :
5. The Three Black Crows
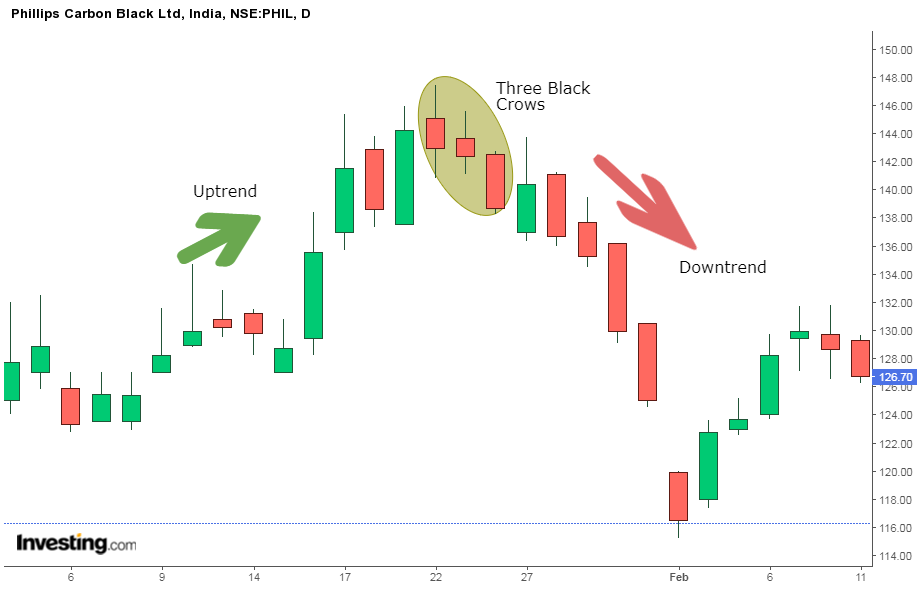
The three black crows pattern is a multiple candlestick pattern used to identify the start of a downtrend after an uptrend. Whenever the price of an instrument falls for three consecutive days because of the selling pressure created by the bearish traders, the three black crows pattern is formed.
Generally, traders initiate a short position after this candlestick pattern. Sometimes traders use volume and other technical indicators to confirm the formation of this candlestick pattern.
Example of formation of Three Black Crows candlestick pattern on the daily chart of Phillips Carbon Black Ltd.
To learn about other candlestick patterns, you can read our blog on 35 Candlestick Chart Patterns Every Trader Must Know.
Conclusion
A bearish reversal candlestick pattern known as the “hanging man” has a large bottom shadow and a little true body. A bearish reversal candlestick pattern known as “Dark Cloud Cover” is created when an uptrend is coming to an end and suggests that the trend may be weakening.
When it emerges at the peak of an uptrend, the bearish engulfing pattern is a bearish reversal pattern that denotes a reversal of the uptrend and a decline in prices as a result of the selling pressure applied by the sellers. Traders utilize the candlestick pattern known as the “Evening Star” to predict when an uptrend will stop and a decline will begin. A multiple candlestick pattern called the “Three Crows” is used to forecast when an upswing will reverse into a decline.
Frequently Asked Questions
1. What are bearish candlestick patterns?
2. Why are bearish candlestick patterns important in trading?
3. What are some common bearish candlestick patterns?
Bearish Engulfing Pattern
Dark Cloud Cover
Evening Star
Bearish Harami
Shooting Star
Hanging Man
4. How can I identify a Bearish Engulfing Pattern?
5. Can bearish candlestick patterns be used in isolation for trading decisions?
6. Are bearish candlestick patterns applicable to all timeframes?
7. How can I improve my accuracy when using bearish candlestick patterns?
Combine candlestick patterns with other technical indicators (e.g., moving averages, RSI, MACD).
Analyze the overall market trend and volume.
Look for patterns forming near significant support or resistance levels.
Practice identifying patterns in historical charts to gain experience.

35 Powerful Candlestick Chart Patterns Every Trader Must Know - SkillsOwl
[…] Bearish reversal candlestick patterns signal a shift from an uptrend to a downtrend.Traders should exercise caution with their long positions once these bearish reversal candlestick patterns emerge.Let’s discuss various types of bearish reversal candlestick chart patterns: […]