35 Powerful Candlestick Chart Patterns Every Trader Must Know
Candlestick chart patterns help in analyzing the price movements of stocks on charts. Candlesticks Explain a detailed account, where the body and wicks of each candlestick indicate the dominance of either the bulls or bears. Furthermore, they offer essential pieces of information like the opening and closing prices, along with the highest and lowest prices achieved during a specific timeframe (day, week, month, or year).
Understanding candlestick chart patterns is crucial for technical analysts in the stock market. By identifying these patterns, analysts can make well-informed predictions about future price trends of the stocks. Candlestick patterns offer a visual representation of price action movement, providing deeper insights into future price movements as compared to bar charts.
Let’s discuss candlestick patterns, Which help to understand the fluctuations in stock prices.
Reading Candlestick Charts
Candlestick charts have their roots in Japan Which existed before Western bar charts and point-and-figure charts for over 100 years. In the 1700s, Homma, a Japanese individual, observed a correlation between rice price fluctuations and supply and demand, as well as the significant impact of traders’ emotions on the markets.
A candlestick chart in day trading is a valuable tool for understanding investor sentiment and the dynamics of supply and demand, as well as the interactions between bears and bulls, greed and fear, and other influencing factors. Traders should keep in mind that while each candle offers valuable information, recognizing patterns requires comparing it with the candles before and after it. To maximize the benefits of these observations, traders need to understand the different patterns present in candlestick charts.
On a daily candlestick chart, the open, high, low, and close prices of a stock for the day are displayed. The wide or rectangular part of the candlestick is referred to as the “real body,” indicating the connection between the opening and closing prices. The real body represents the price range between the day’s opening and closing in trading.
A filled, black, or red real body indicates a bearish candle, signifying that the close was lower than the open. This suggests that prices opened, were pushed down by bears, and closed below the opening price. An empty, white, or green real body signifies a bullish candle, indicating that the close was higher than the open. This shows that prices opened, were pushed up by bulls, and closed above the opening price.
The thin vertical lines above and below the real body are called wicks or shadows, representing the high and low prices during the trading session. The upper shadow reflects the highest price, while the lower shadow indicates the lowest prices reached during the trading session.

Specific assumptions related to candlestick charts that should be considered. as follows :
- A bullish or green candle symbolizes strength, while a bearish or red candle represents weakness. It is important to buy on green candle days and sell on red candle days.
- Although the textbook defines a pattern with specific criteria, minor variations may occur based on market conditions.
- Prior trend analysis is crucial. For a bullish reversal pattern, the prior trend should be bearish, and for a bearish reversal pattern, the prior trend should be bullish.
Different Types of Candlestick Patterns
The candlestick patterns can be categorized into three categories:
- Bullish Reversal Pattern
- Continuation Pattern
Bullish Reversal Candlestick Patterns
Bullish Reversal candlestick patterns signal a shift from a downtrend to an uptrend. Traders need to be careful with their short positions when these bullish reversal candlestick chart patterns emerge.
Here are various types of bullish reversal candlestick patterns:
Hammer Pattern
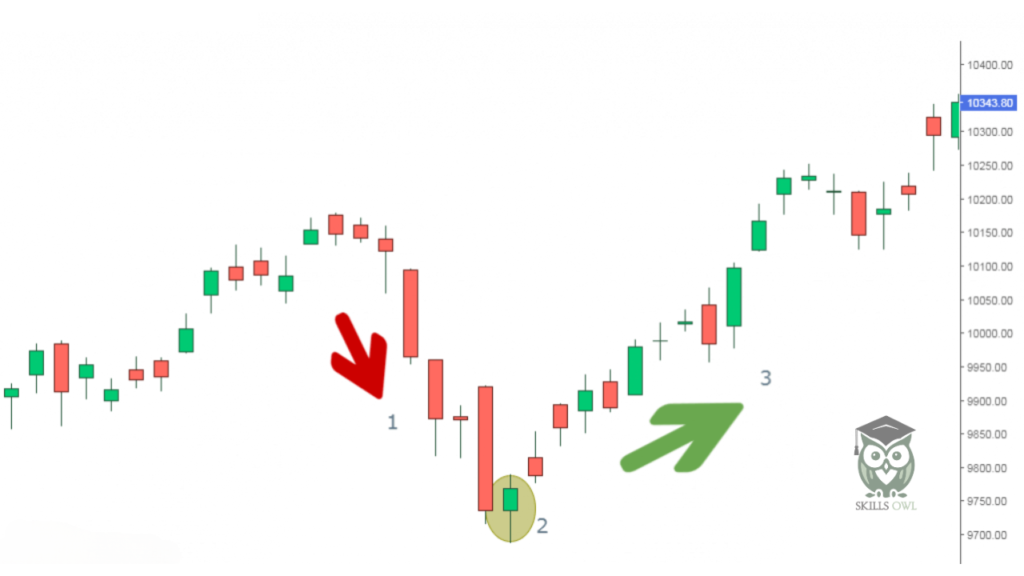
This type of candle is identified by a small body and a long lower wick. Usually observed after a downtrend, it suggests that a significant wave of buying pushed prices higher despite selling pressure. A green-bodied candle signifies a more robust bull market compared to a red-bodied one. The “Hammer” candlestick pattern emerges after a downtrend, indicating a shift towards a bullish trend.
This pattern features a small real body positioned at the top, accompanied by a significantly longer lower shadow that should be at least twice the length of the real body. Typically, there is no or very little upper shadow present.
The rationale behind this candle pattern is as follows: prices open, prompting sellers to drive prices down. Subsequently, buyers enter the market, driving prices upward and concluding the trading session above the opening price. As a result, a bullish pattern has emerged, indicating a return of buyers in the market and a potential end to the downtrend. To capitalize on this, traders may consider entering a long position if a bullish candle forms the next day, with a stop-loss set at the low of the Hammer pattern.
Here is an example of the Hammer Candlestick Pattern:
Inverted Hammer
An Inverted Hammer emerges at the end of a downtrend, indicating a bullish reversal. This candlestick pattern features a real body positioned at the end, accompanied by a lengthy upper shadow. It serves as the opposite of the Hammer Candlestick pattern.
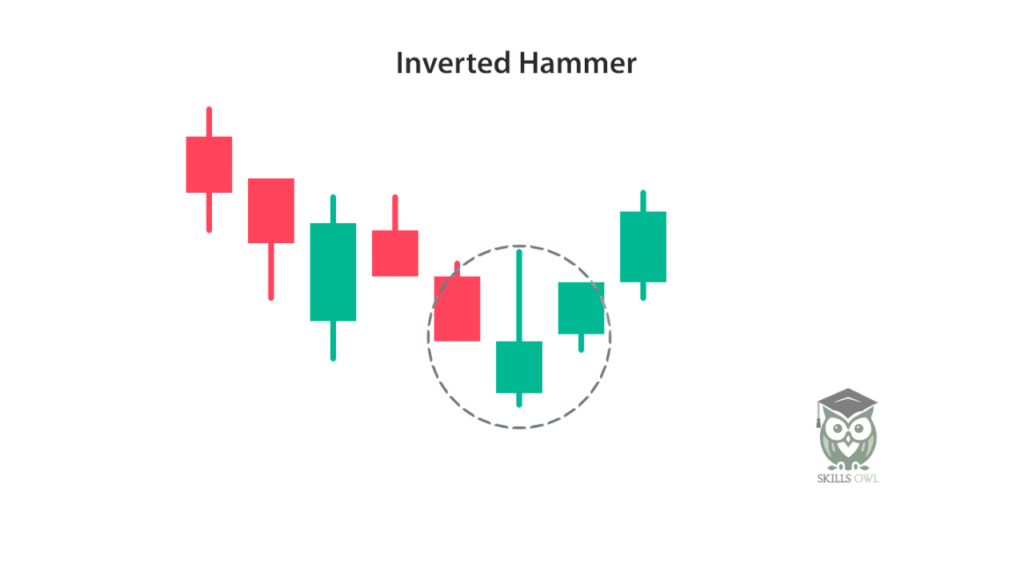
The formation of this pattern occurs when the opening and closing prices are nearby, with the upper shadow extending more than twice the length of the real body.
Three White Soldiers
This three-candle pattern consists of three green candles with small wicks, each opening and closing at higher levels than the day before. When seen following a downtrend, this pattern indicates a high probability of a bullish trend beginning soon. The Three White Soldiers is a multi-candlestick pattern that emerges following a downtrend, signaling a shift towards a bullish reversal. These candlestick patterns consist of three extended bullish patterns with minimal shadows, opening within the real body of the preceding candle within the sequence.

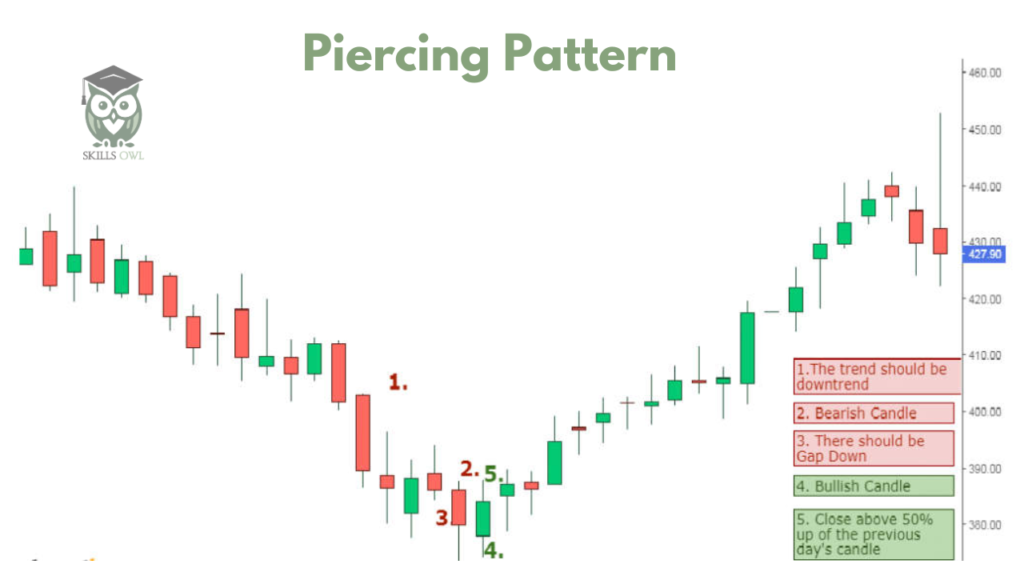
Piercing Pattern
This pattern consists of a long red candle succeeded by an equally long green candle. Additionally, the closing price of the second candle should be above the midpoint of the first candle’s body. This setup indicates strong buying momentum in the market. The piercing pattern, a multiple candlestick chart pattern, emerges after a downtrend and signals a bullish reversal.
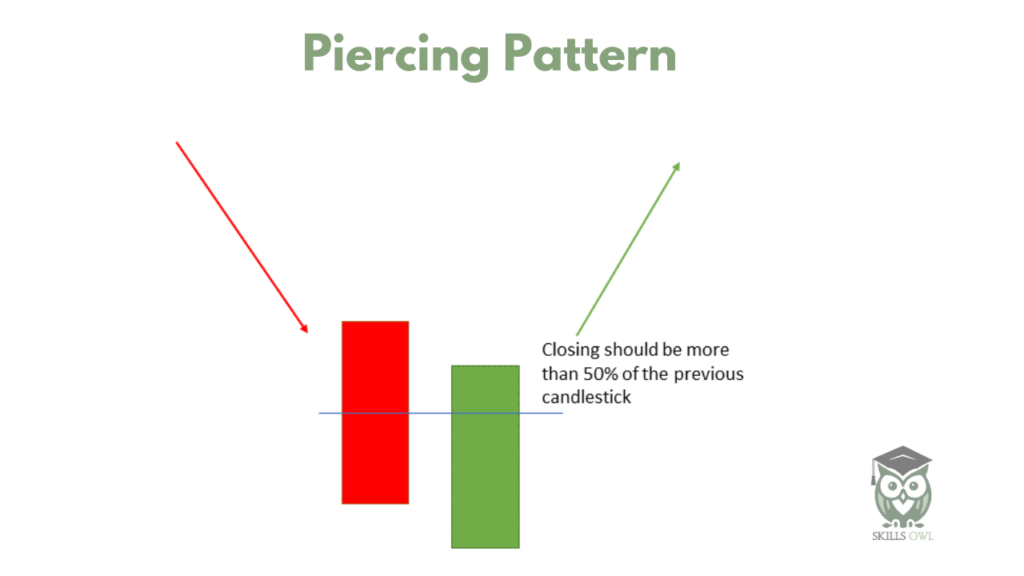
This pattern consists of two candles:
- The first candle is bearish, suggesting the downtrend will persist.
- The second candle is bullish, opening with a gap down but closing over 50% of the previous candle’s real body. This indicates a shift in market sentiment, with the bulls regaining control and a forthcoming bullish reversal.
Traders may consider going long if a bullish candle forms the next day and can set a stop-loss at the low of the following candle.
Here is an example of the Piercing Candlestick Pattern
Three Outside Up
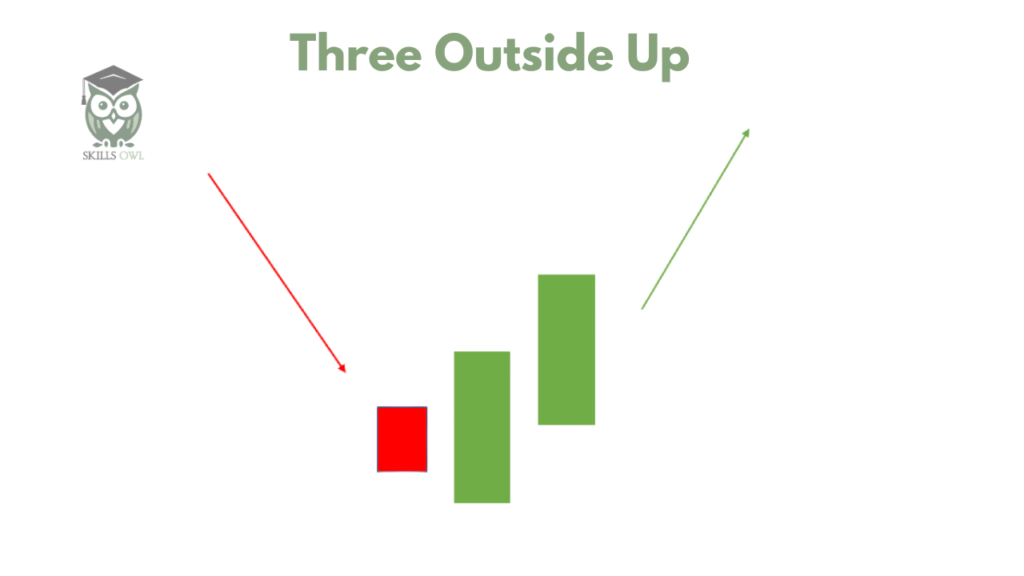
The Three Outside Up Pattern is a multi-candlestick pattern that emerges after a downtrend, signaling a bullish reversal. This pattern comprises three candlesticks.
- The first candle is short and bearish.
- The second candle is a large bullish one that engulfs the first candle.
- The third candle is a long bullish candle confirming the bullish reversal.
The first and second candlestick charts should exhibit the Bullish Engulfing candlestick pattern.
After this pattern is formed, traders may consider opening a long position.
White Marubozu
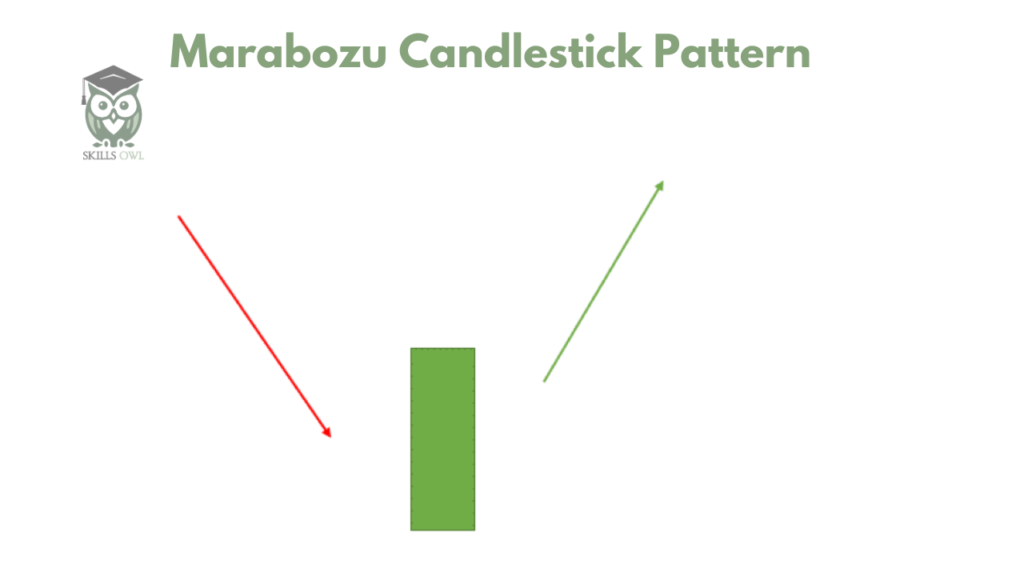
The White Marubozu is a candlestick pattern that emerges following a downtrend, signaling a shift to a bullish market. It features a long bullish body with no upper or lower shadows, indicating significant buying pressure from the bulls and a potential shift towards a bullish trend. When this candle forms, sellers should exercise caution and consider closing their short positions.
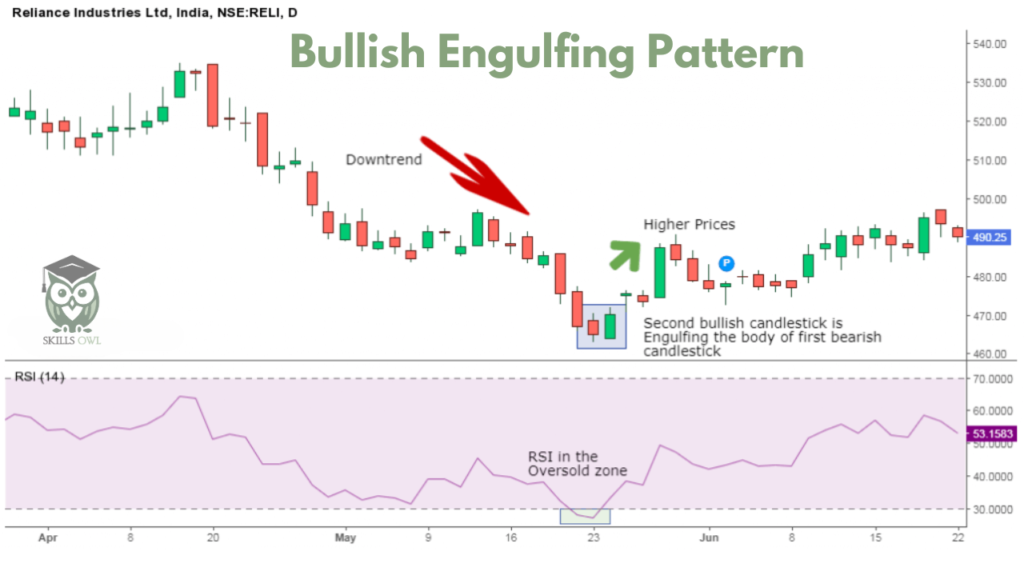
Bullish Engulfing Pattern
This pattern involves two candlesticks. The first one is a small red candle enclosed with a larger green candle. It indicates a bullish market trend that pushes the price higher, despite opening lower than the previous day. Bullish Engulfing A multiple candlestick chart pattern emerges following a downtrend, signaling a bullish reversal.
Consisting of two candles, the second candle engulfs the first. The initial candle is bearish, denoting the downtrend’s persistence. The subsequent candle is a lengthy bullish one, fully engulfing the first candle and signifying the return of bullish activity in the market.
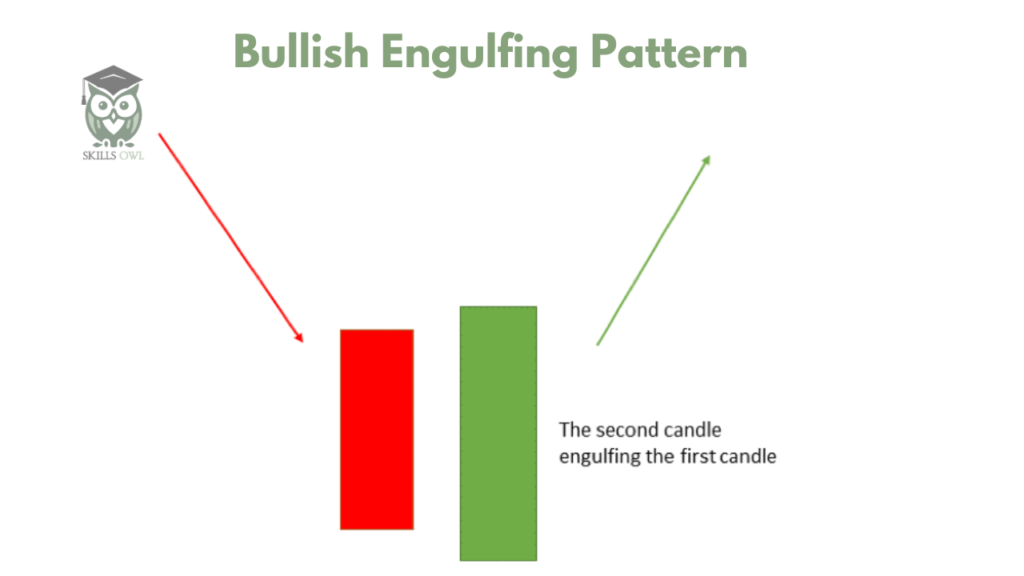
Traders may consider taking a long position if a bullish candle forms the next day, and they can set a stop-loss at the low of the following candle. Here is an example of a Bullish Engulfing Candlestick Pattern:
On-Neck Pattern
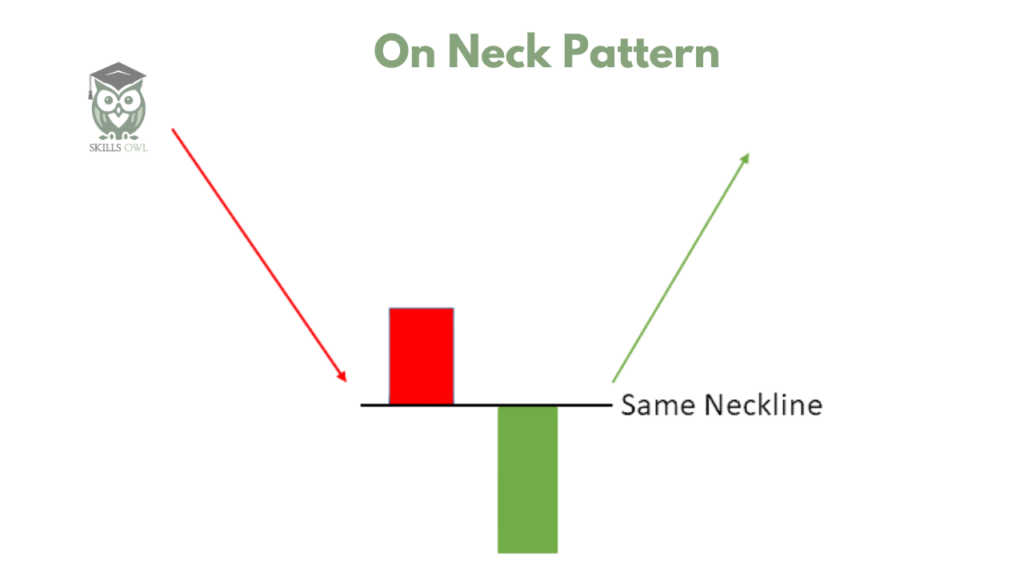
After a downtrend, the On Neck Candlestick Pattern emerges when a large bearish candle is succeeded by a smaller bullish candle that initially gaps down on the open but later closes near the prior candle’s close. This pattern gets its name from the horizontal neckline created by the two candles, as their closing prices are identical or very close.
Three Inside Up
The Three Inside Up pattern emerges after a downtrend and signals a potential bullish reversal with multiple candlesticks:
- It involves three candlesticks.
- The first is a lengthy bearish candle.
- The second candlestick is a small bullish one, ideally within the range of the first candlestick.
- The third candlestick is a significant bullish one, validating the bullish reversal.
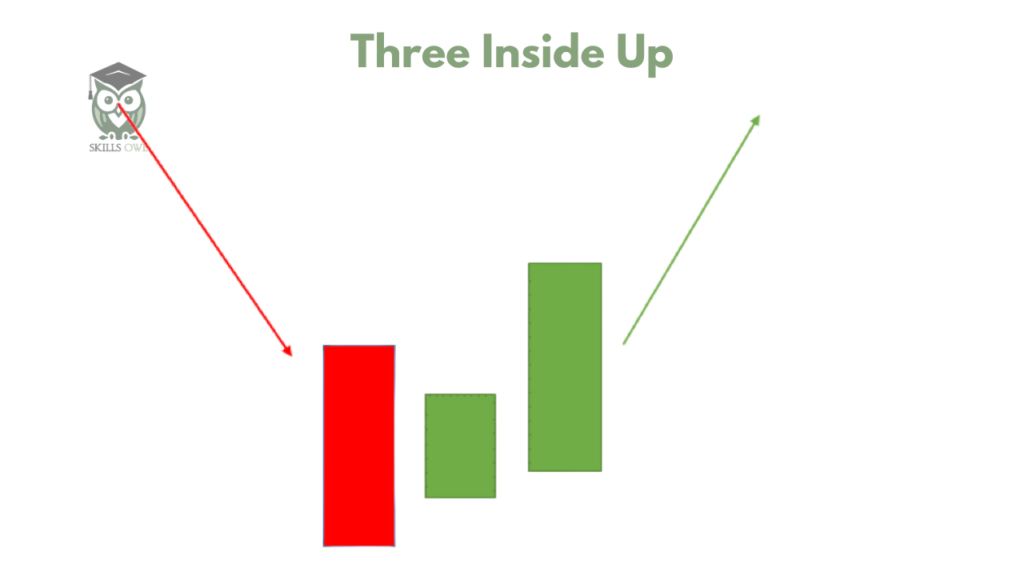
The first and second candlesticks should form a bullish harami candlestick pattern. After this pattern is complete, traders can consider taking a long position.
Tweezer Bottom
The Tweezer Bottom Candlestick Pattern serves as a bullish reversal signal occurring after a downtrend. This pattern involves two candlesticks, with the first being bearish and the second turning bullish. Both candlesticks usually reach nearly the same low point. The appearance of the Tweezer Bottom candlestick pattern indicates a previous downtrend.
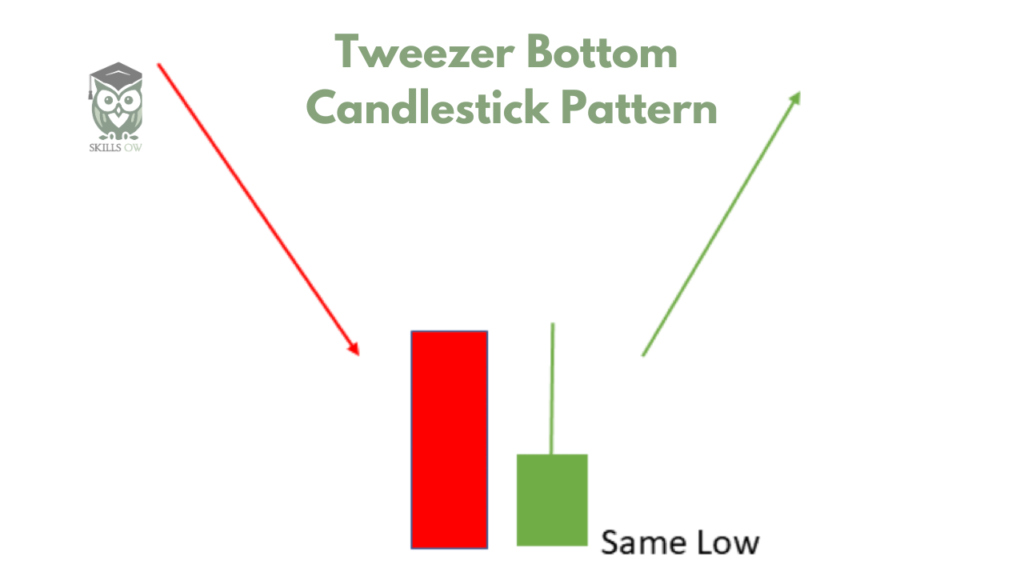
A bearish tweezer candlestick pattern emerges, suggesting a continuation of the current downtrend. The following day, the low of the bullish candle indicates a support level. Candles at the bottom with nearly identical lows reinforce the support level’s strength and hint at a potential reversal from a downtrend to an uptrend. As a result, the bulls become active and drive the price upward. The bullish reversal is validated the following day as another bullish candle forms.
Morning Star Pattern
The three-candle pattern includes a brief-bodied candle positioned between a lengthy red candle and a lengthy green candle. Normally, there is no overlap between the short and long candles. This setup clearly suggests a decrease in selling pressure and the beginning of a bullish market.
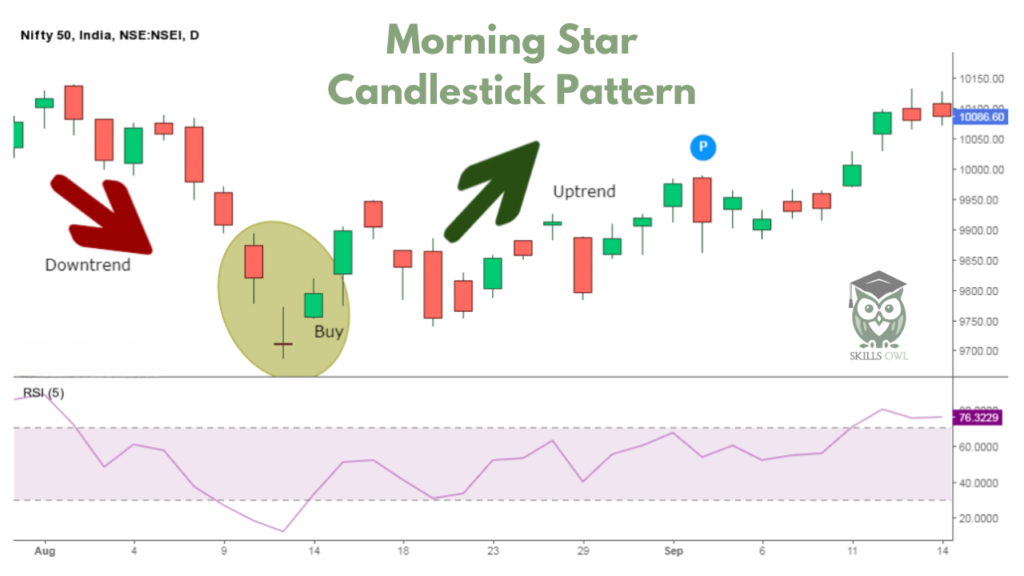
The Morning Star pattern, a multiple candlestick chart formation, appears after a downtrend to signal a bullish reversal. It consists of three candlesticks: the first is bearish, the second is a Doji, and the third is bullish.
- The initial candle signifies the downtrend continuation.
- The Doji candle reflects market indecision.
- The bullish candle indicates a market shift with the bulls taking charge for a reversal.
- For the pattern to be valid, the second candle should not overlap with the real bodies of the first and third candles.
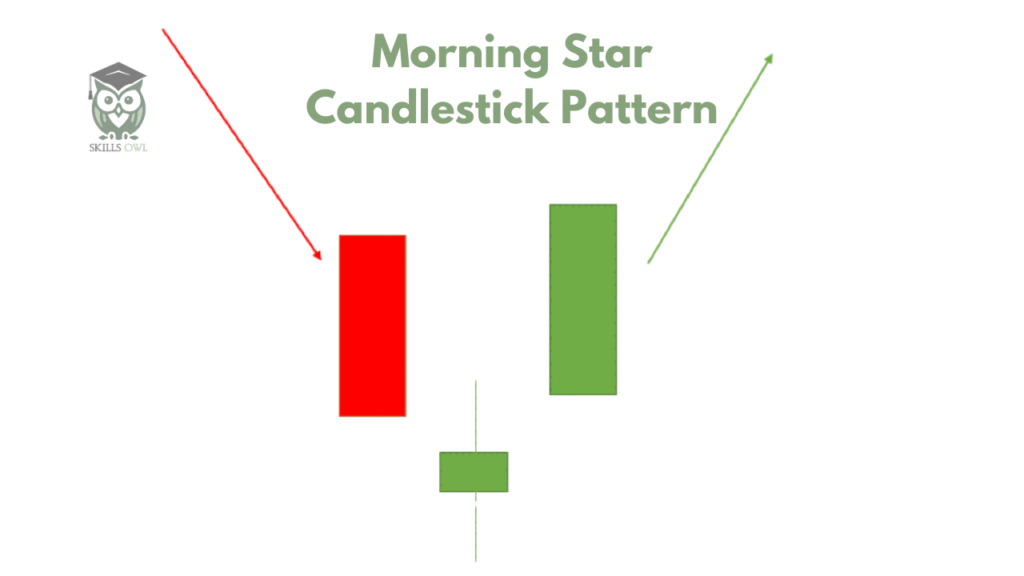
If a bullish candle forms the next day, traders may consider entering a long position and setting a stop-loss at the low of the following candle.
Below is an example of the Morning Star Pattern.
Bullish Counterattack
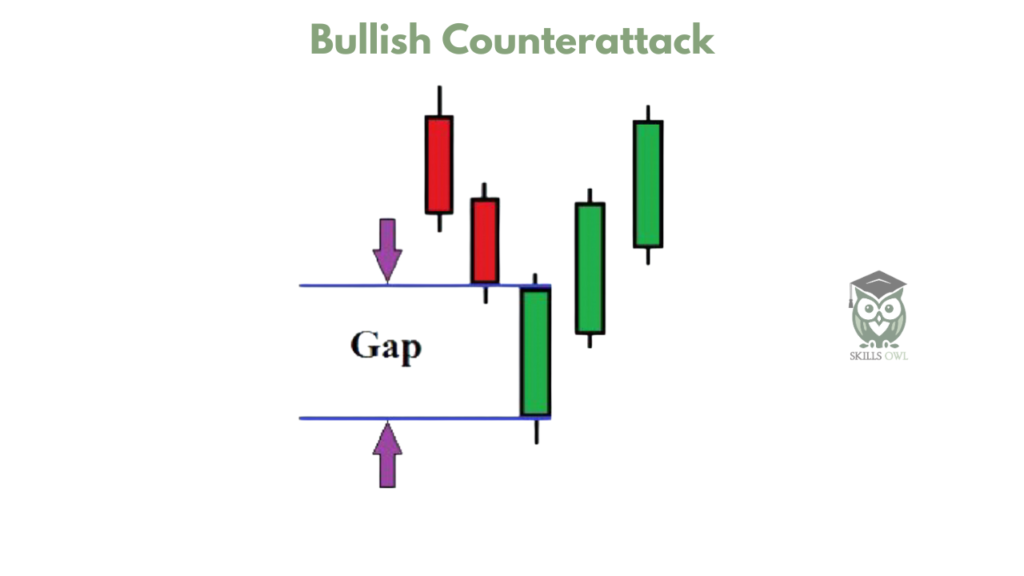
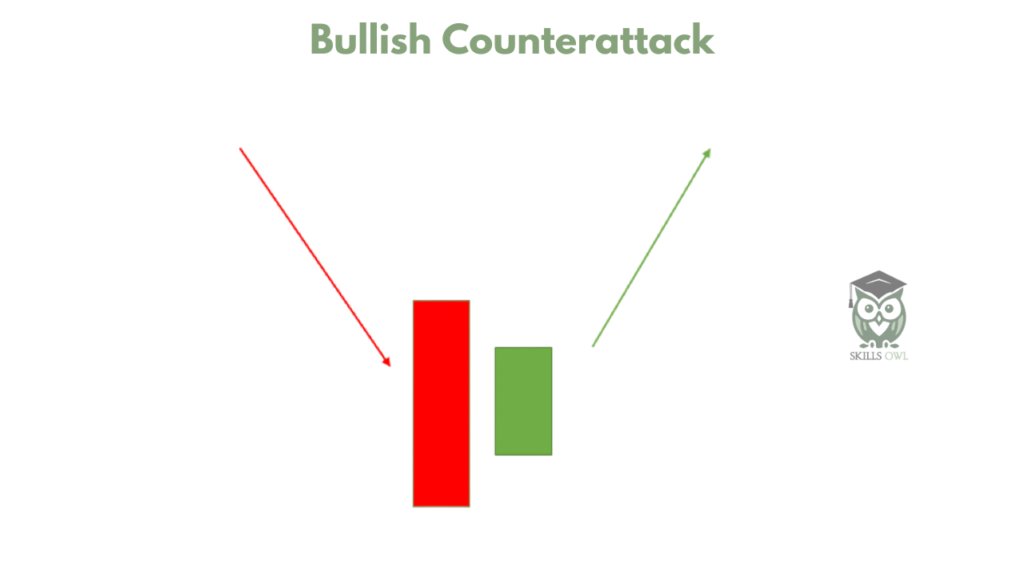
The Bullish Counterattack Pattern is a signal of a potential reversal in the market’s downtrend. This two-bar candlestick formation emerges during a market decline and must satisfy specific criteria to be identified as a bullish counterattack pattern:
- A robust downtrend should be established for the bullish counterattack pattern to develop.
- The first candle should be a lengthy red candle with a real body.
- The second candle, also long (ideally matching the first candle’s size), should be green with a real body. Its closing should be close to the first candle’s closing.
Bullish Harami
The Bullish Harami is a candlestick chart pattern that appears after a downtrend, signaling a bullish reversal. It is made up of two candlesticks:
The first one is a large bearish candle, followed by a smaller bullish candle that falls within the range of the first candle. The initial bearish candle indicates the continuation of the downtrend, while the subsequent bullish candle suggests the return of bullish sentiment in the market.
After this candlestick pattern is formed, traders have the opportunity to take long positions.
Bearish Candlestick Pattern Overview
Bearish reversal candlestick patterns signal a shift from an uptrend to a downtrend.
Traders should exercise caution with their long positions once these bearish reversal candlestick patterns emerge.
Let’s discuss various types of bearish reversal candlestick chart patterns:
Hanging man
This candle displays a brief body and an extended lower wick, commonly seen at the climax of a rising trend. It indicates that selling pressure has surpassed buying momentum, indicating a shift in market control towards the bears. The Hanging Man is a candlestick pattern that appears after an uptrend, indicating a potential bearish reversal.
This pattern consists of a small real body positioned at the top, accompanied by a long lower shadow that should be at least twice the size of the real body. Typically, the Hanging Man lacks an upper shadow. The rationale behind this candle formation is that prices commence with a downward push initiated by sellers. Subsequently, buyers enter the market, attempting to drive prices up; however, they fail, resulting in prices closing below the opening price.
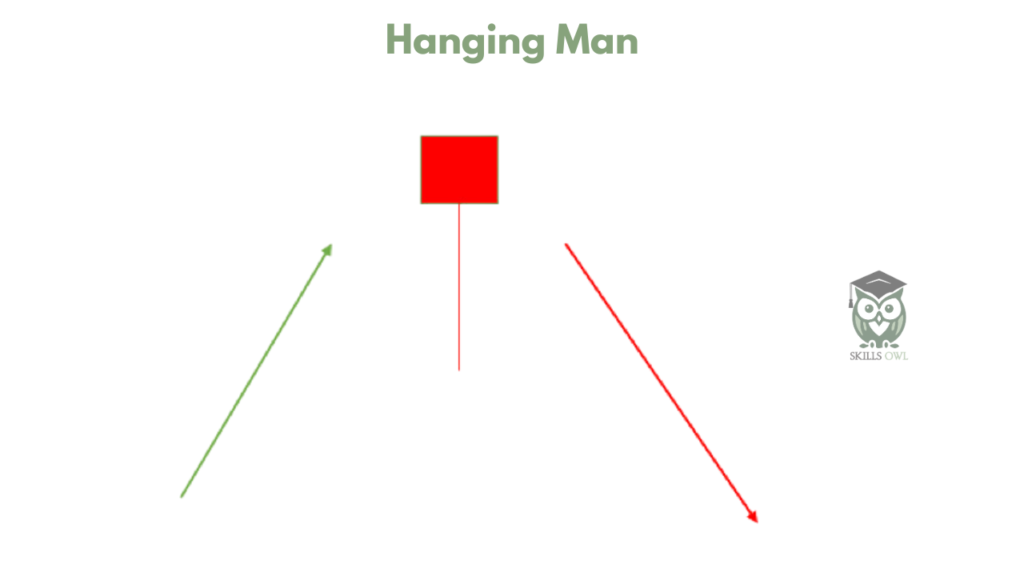
This has led to the emergence of a bearish pattern, indicating the return of sellers to the market and a possible end to the uptrend.
For traders looking to enter a short position, watch for the formation of a bearish candle the following day and set a stop-loss at the high of the Hanging Man candlestick.
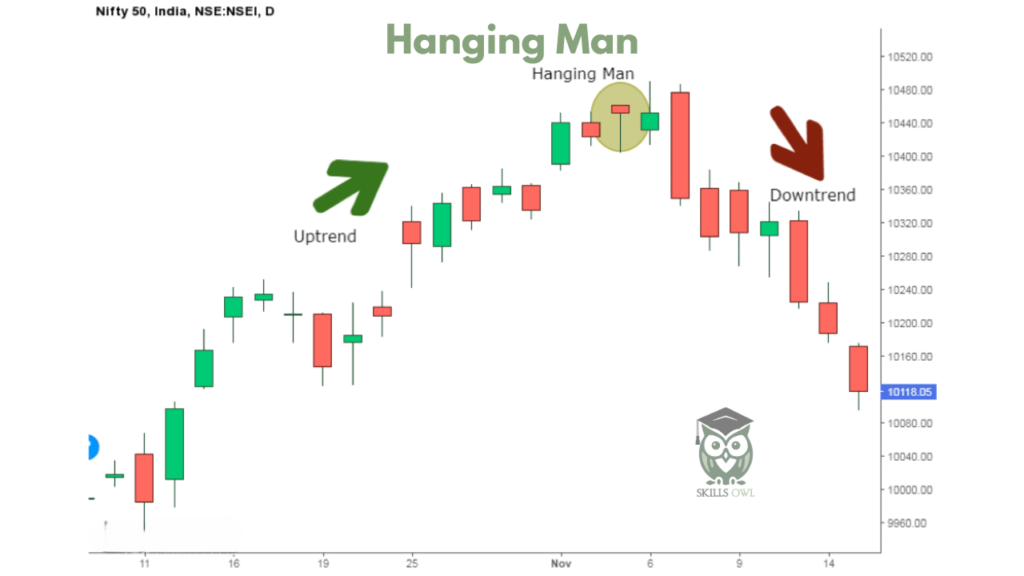
Here is an example of the Hanging Man Candlestick Pattern :
Bearish Engulfing
In candlestick chart analysis, a pattern consists of two candlesticks. The first candlestick is a small green one completely engulfed by a larger red candle. This pattern usually appears at the peak of an upward trend, indicating a slowdown in the market’s upward momentum and a forthcoming downtrend. The following downtrend tends to be more significant if the red candle is larger.
The Bearish Engulfing pattern, a multiple candlestick formation, emerges after an uptrend, signaling a shift to bearish sentiment. It consists of two candles, with the second one engulfing the first. The initial bullish candle denotes the uptrend’s continuation, while the subsequent long bearish candle engulfing it signifies the return of bearish market sentiment.
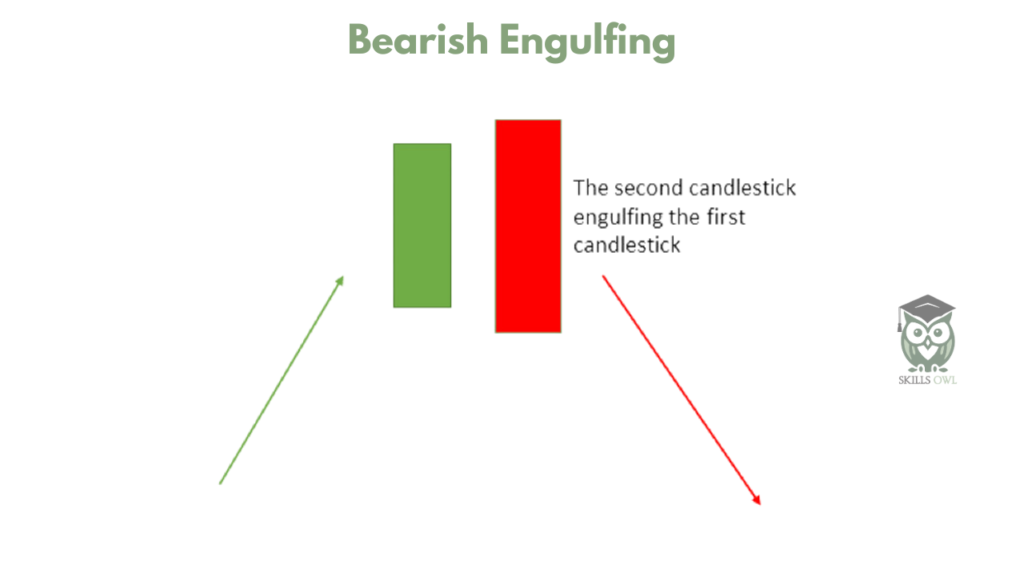
Traders may consider entering a short position if a bearish candle forms the next day and can set a stop-loss at the high of the following candle.
The Evening Star
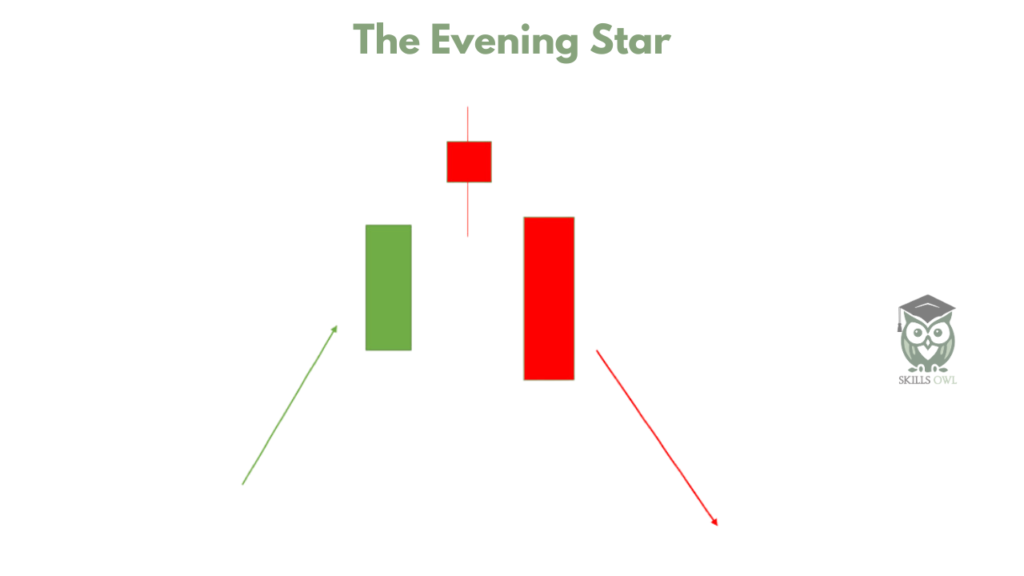
The three-candle pattern includes a short-bodied candle placed between a long red candle and a long green candle, without any overlap. This pattern signals a potential reversal in an upward trend. The reversal’s strength is amplified if the third candle exceeds the gains of the first candle.
Traders may consider entering a short position if a bearish candle forms the next day, and they can set a stop-loss at the high of the following candle.
Here is an example of the Evening Star Candlestick Pattern:
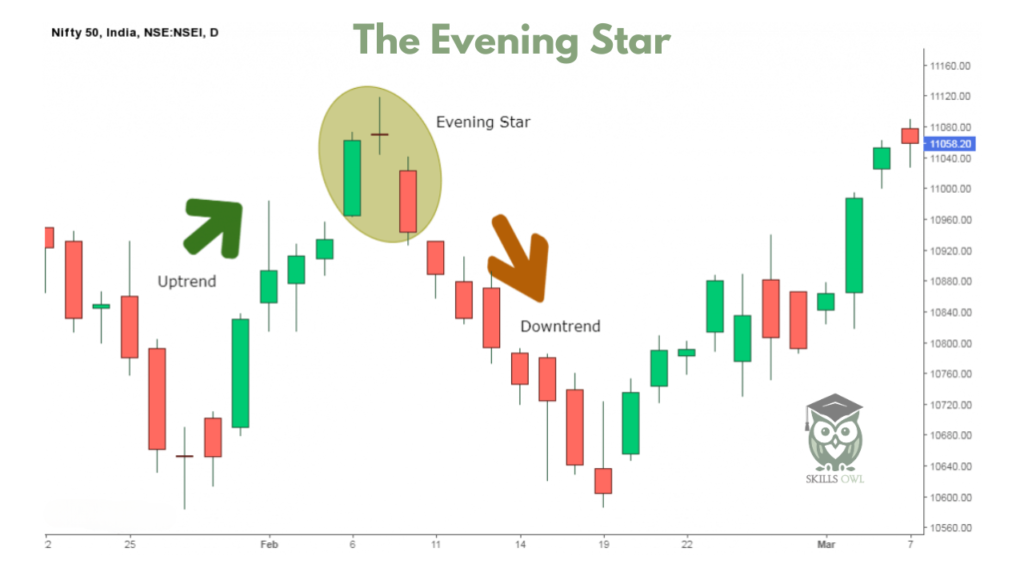
The Evening Star is a multiple candlestick pattern that emerges after an uptrend, signaling a bearish reversal. It consists of three candlesticks: a bullish candle, a doji, and a bearish candle. The first candle confirms the uptrend, the doji reflects market indecision, and the bearish candle signals the return of bears and an upcoming reversal. The doji candle needs to be entirely outside the real bodies of the first and third candles.
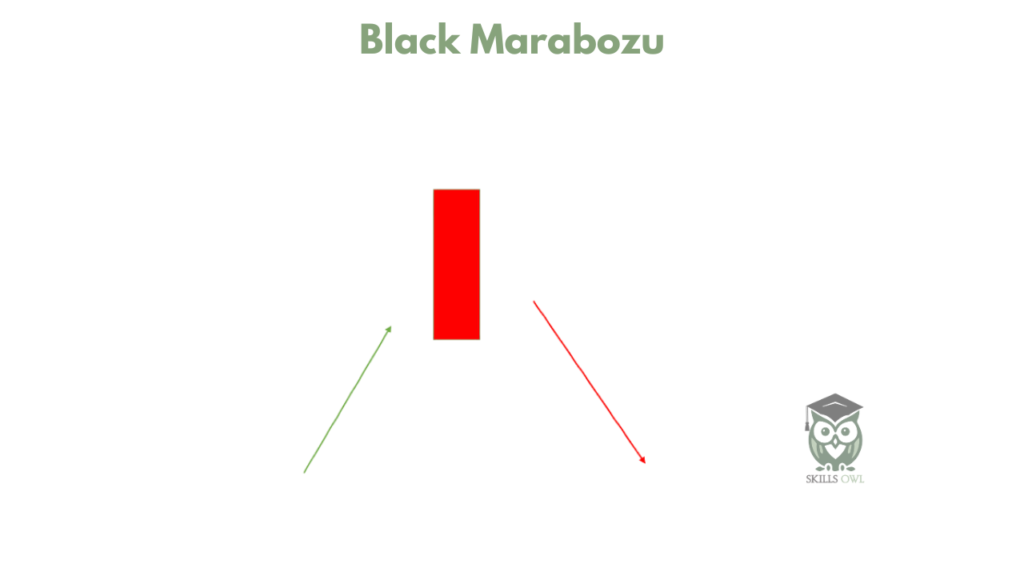
Black Marubozu
The Black Marubozu is a candlestick pattern that emerges after an uptrend, signaling a potential bearish reversal. This pattern features a long bearish body without upper or lower shadows, indicating strong selling pressure from bears and a possible shift to bearish market sentiment. Traders should exercise caution when this candle forms and consider closing their buying positions.
Dark Cloud Cover
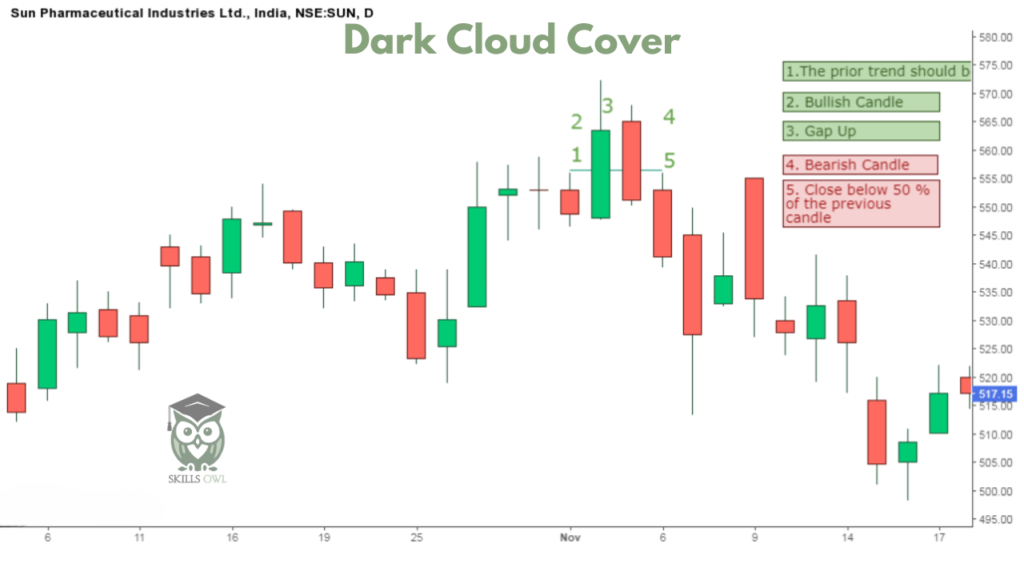
Dark Cloud Cover This pattern consists of multiple candlesticks and occurs following an uptrend, signaling a potential bearish reversal.
The pattern involves two candles:
- The first candle is bullish, suggesting the uptrend will continue.
- The second candle is bearish, opening with a gap up but closing over 50% of the previous candle’s real body. This indicates a market shift towards a bearish sentiment and an impending bearish reversal.
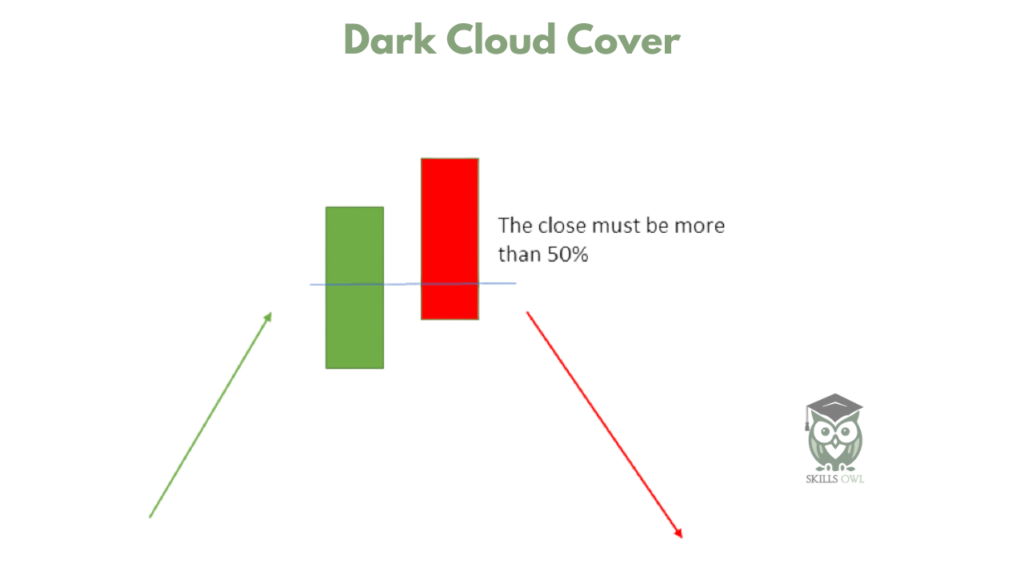
Traders may take a short position if a bearish candle forms the following day and can set a stop-loss at the high of the subsequent candle.
Here’s an example of a Dark Cloud candlestick pattern:
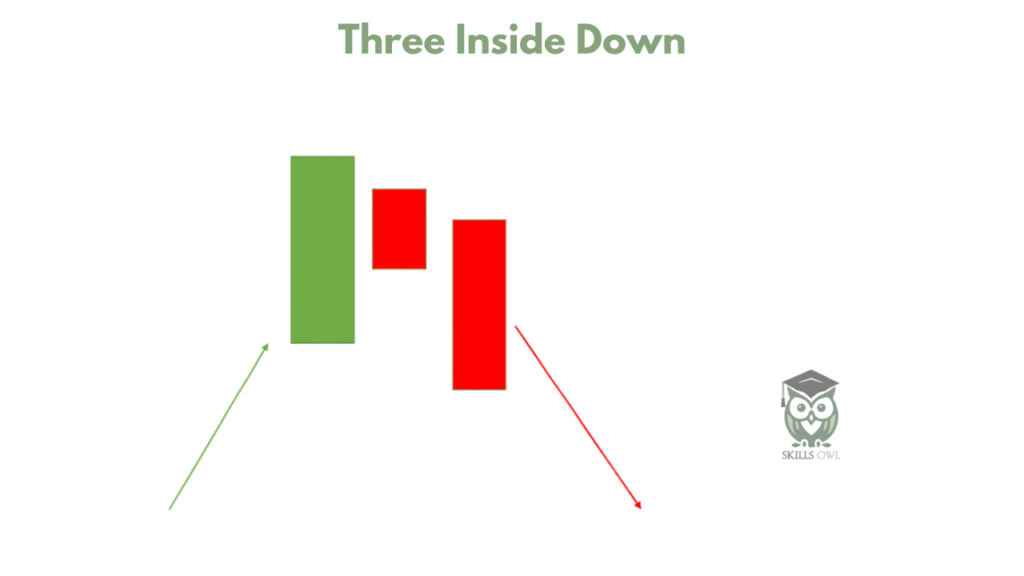
Three Inside Down
The Three Inside Down pattern is a multi-candlestick formation that emerges after an uptrend, signaling a shift towards a bearish trend. This pattern includes three candlesticks. The initial one is a large bullish candle, followed by a smaller bearish candlestick that falls within the range of the first candle.
The final candlestick is a lengthy bearish one, validating the bearish reversal. The connection between the first and second candlesticks should resemble the bearish Harami candlestick pattern. After this candlestick pattern is formed, traders may consider taking a short position.
Shooting Star
A Shooting Star emerges after an uptrend, indicating a bearish reversal.
In this candlestick chart, the real body is situated at the end, accompanied by a lengthy upper shadow. This pattern is the opposite of the Hanging Man Candlestick formation.
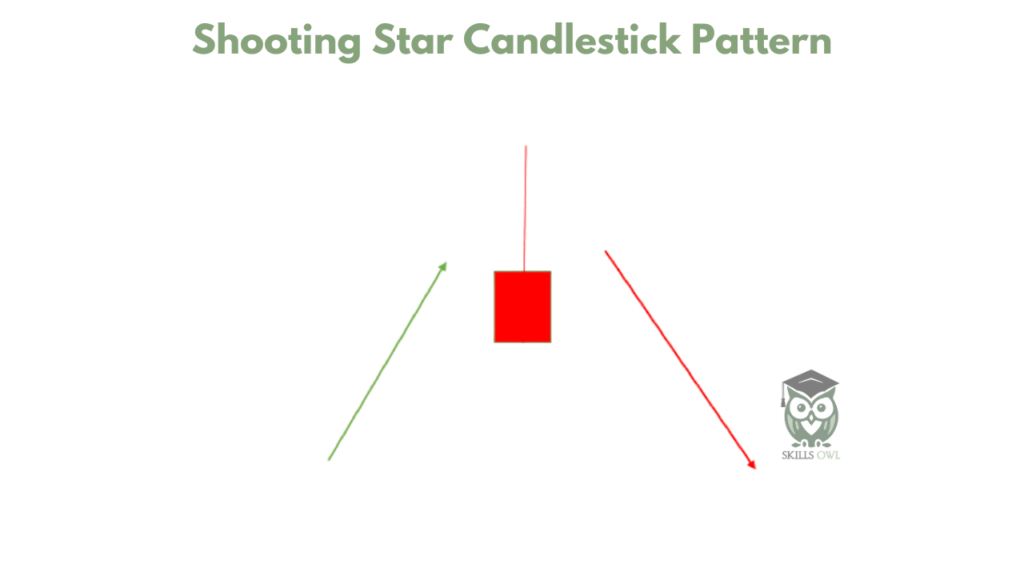
This pattern occurs when the opening and closing prices are close together, with the upper shadow being at least twice the size of the real body.
Three Black Crows
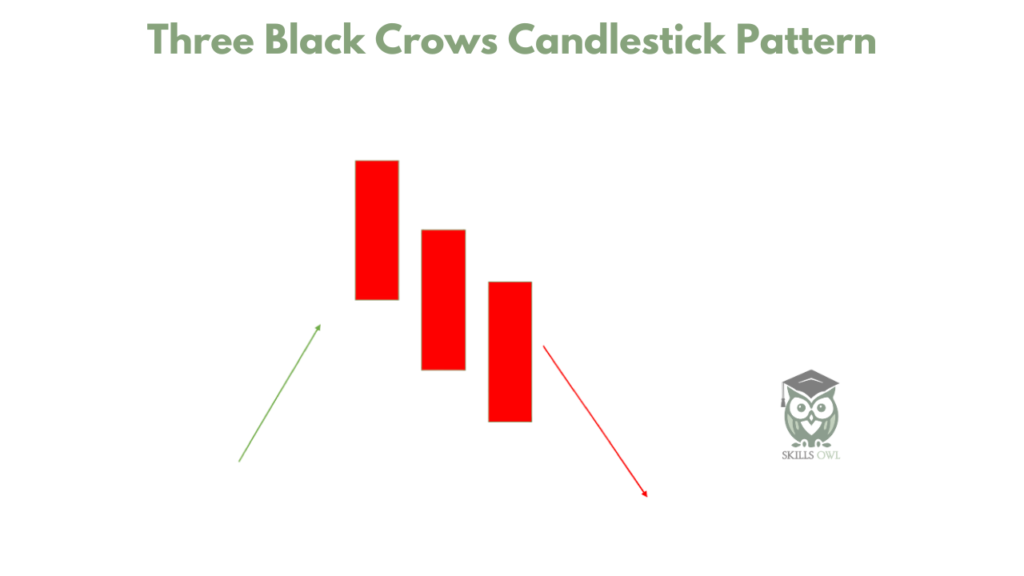
The Three Black Crows is a candlestick pattern consisting of three long bearish candles that appear after an uptrend, signaling a potential bearish reversal. These candles have minimal shadows and open within the real body of the preceding candle in the sequence.
The three-candle pattern consists of three consecutive red candles with minimal wicks, each opening and closing at lower levels than the day before. When identified following an upward trend, this pattern strongly signals an approaching bear market.
Tweezer Top
The Tweezer Top pattern serves as a bearish reversal candlestick formation observed after an upward trend. This pattern features two candlesticks, with the first one being bullish and the following one bearish, both nearly identical in height. When the Tweezer Top Candlestick Pattern emerges, it signifies a prior uptrend. Initially, a bullish candlestick suggests a continuation of the ongoing upward trend.
Subsequently, the high of the second day’s bearish candle acts as a resistance level, indicating a reluctance (unwillingness) from buyers to purchase at elevated prices despite attempts by bulls to push the price higher.
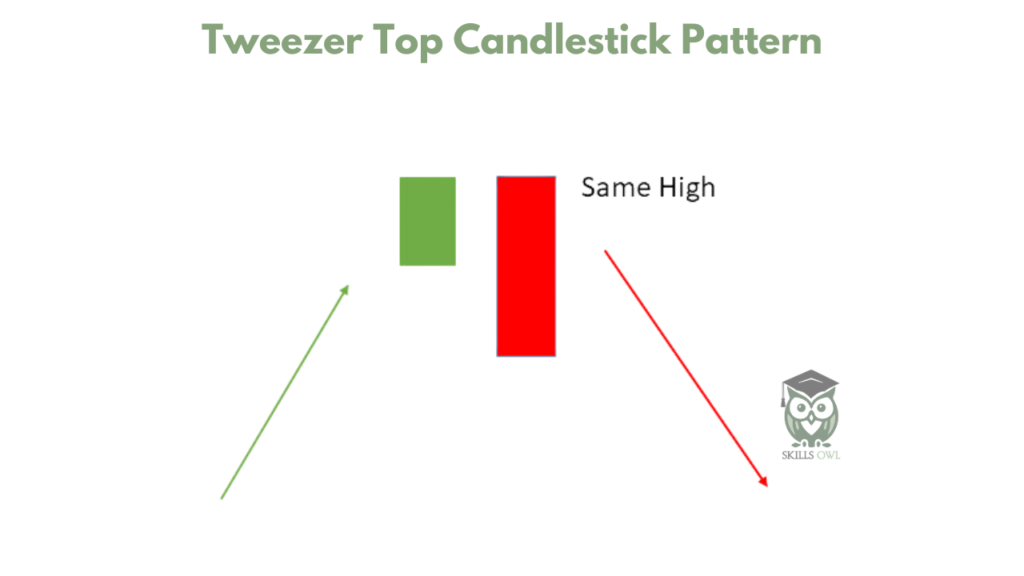
The highest candles, with nearly identical highs, demonstrate the resistance’s strength and suggest a potential reversal from an uptrend to a downtrend. This bearish shift is validated the following day when a bearish candle appears.
Bearish Counterattack
The Bearish Counterattack Candlestick Pattern is a signal of a potential reversal during an uptrend in the market. It indicates a shift from the current uptrend to a new downtrend in the market.
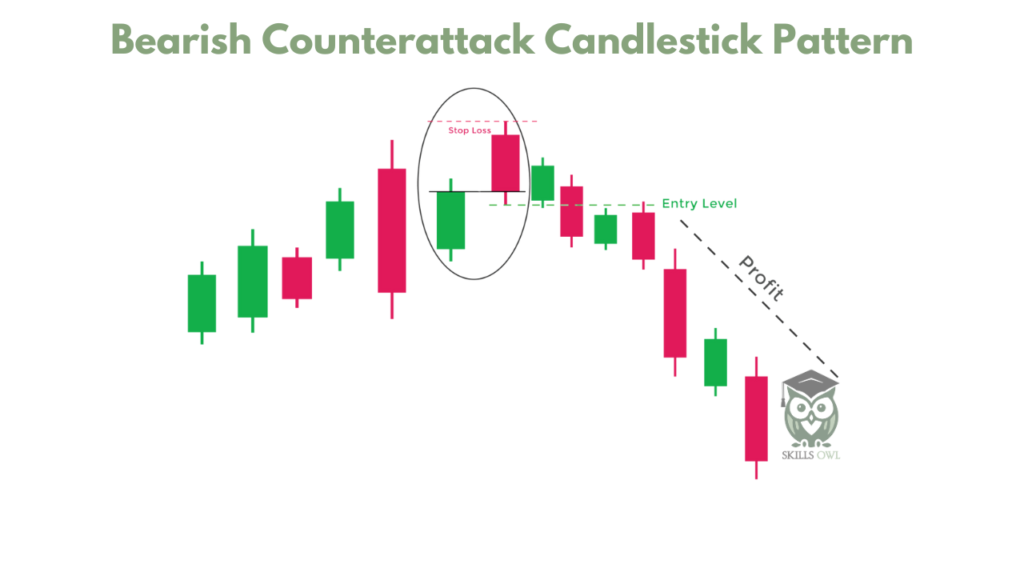
Bullish counterattack lines signal a potential reversal from a downtrend into an uptrend. Bearish counterattack lines signal a potential reversal from an uptrend into a downtrend. The pattern is composed of two candles of opposite colors/directions.
Bearish Harami
The Bearish Harami is a candlestick pattern that emerges after an uptrend, signaling a potential bearish reversal. This pattern comprises two candlesticks: the first one is a large bullish candle, followed by a smaller bearish candle that falls within the range of the first candle on the chart.
The initial bullish candle signifies the ongoing bullish trend, while the subsequent candle indicates the return of bearish sentiment in the market.
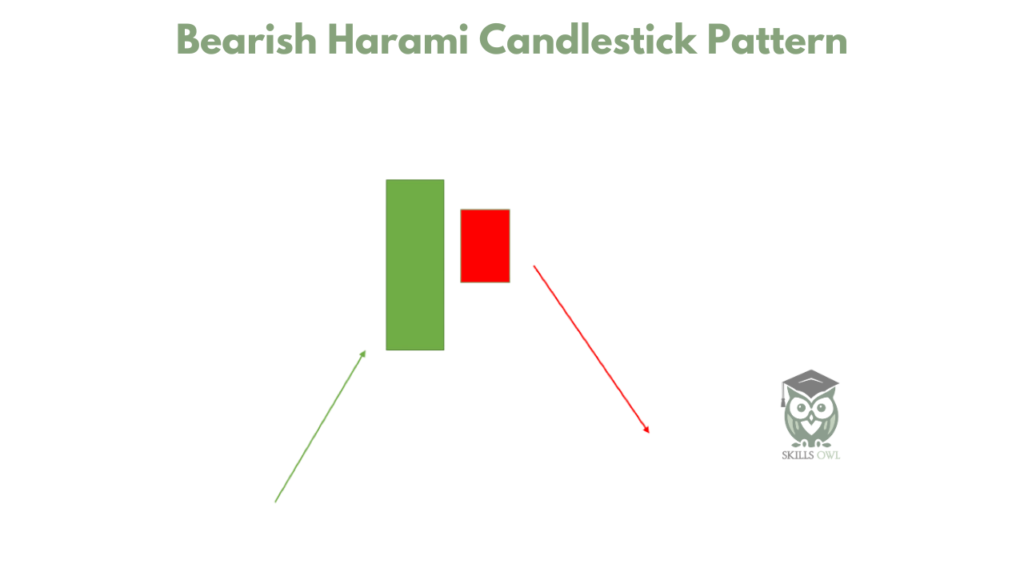
After this candlestick pattern is finished, traders may consider taking a short position.
Three Outside Down
The Three Outside Down is a candlestick pattern that appears after an uptrend and signals a bearish reversal. It comprises three candlesticks.
- The first candle is a small bullish one.
- The second candle is a large bearish one that engulfs the first candle.
- The third candle is a long bearish one that validates the bearish reversal.
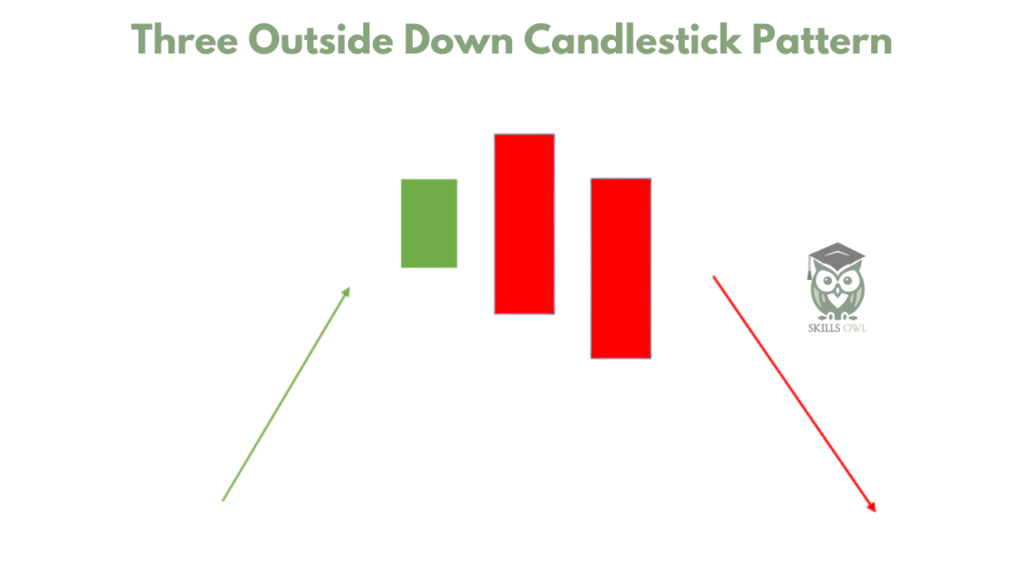
The first and second candlesticks should evidence the Bearish Engulfing Candlestick Pattern. Traders may consider a short position once this pattern is fully formed.
Continuation Candlestick Patterns
A continuation pattern in the financial markets is an indication that the price of a stock or other asset will continue to move in the same direction even after the continuation pattern is completed.
There are several continuation patterns that technical analysts use as signals that the price trend will continue. Examples of continuation patterns include triangles, flags, pennants, and rectangles.
Doji
The Doji Pattern represents a candlestick pattern in price action that signifies indecision, occurring when the opening and closing prices are nearly identical.
This pattern emerges when both bullish and bearish forces are in a struggle for price control, yet neither side manages to dominate the price movement.
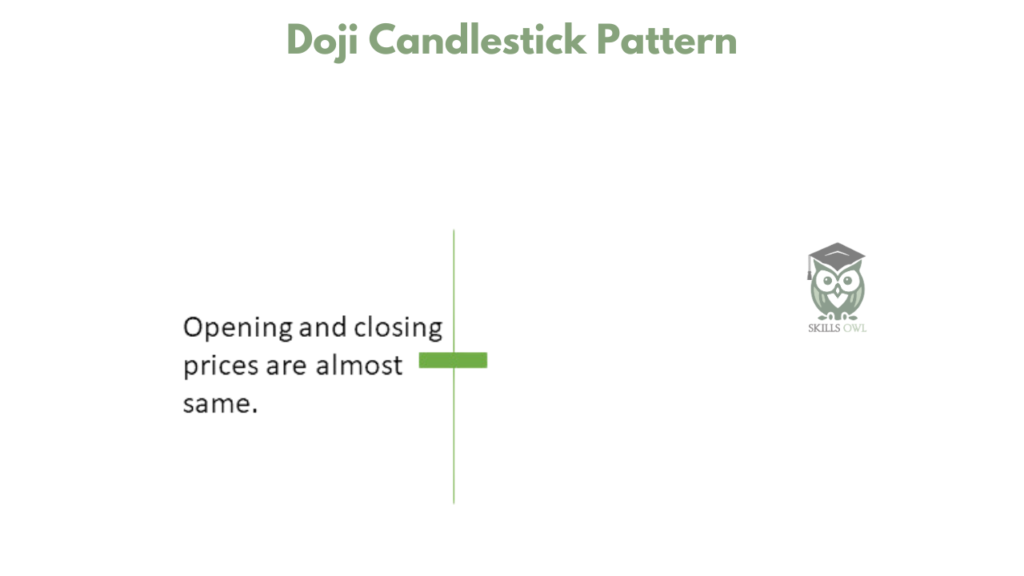
The candlestick pattern resembles a cross, featuring a minimal real body and elongated shadows.
High Wave
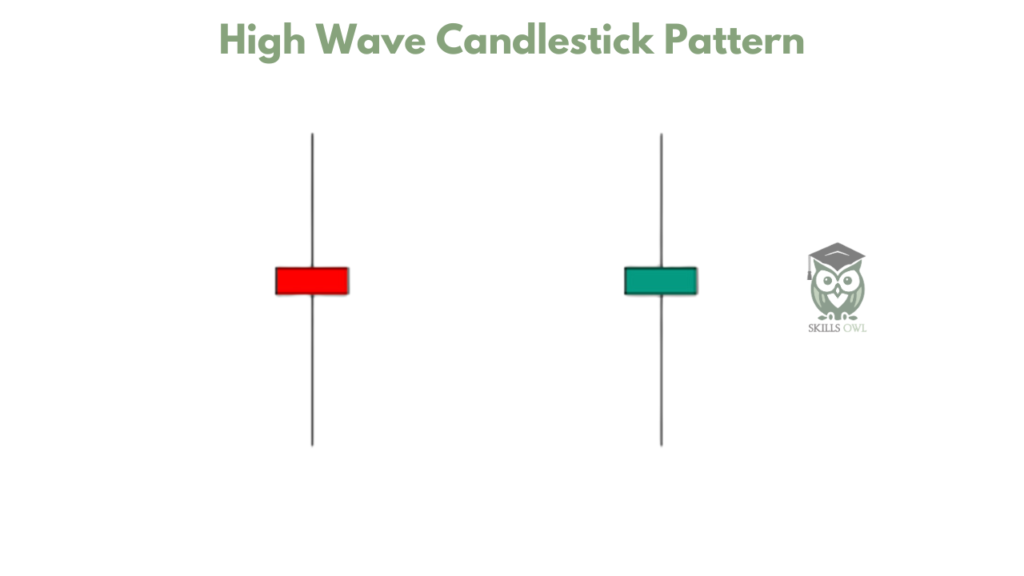
The High Wave Candlestick Pattern represents a state of indecision in the market, indicating neither bullish nor bearish sentiment. Typically observed at support and resistance levels, this pattern reflects a tug-of-war between bears and bulls, each vying to influence the price movement.
Recognizable by long lower shadows and upper wicks, along with small bodies, these candlesticks illustrate significant price fluctuations during the period. Despite the volatility, the price generally closes near its opening value.
Spinning Top
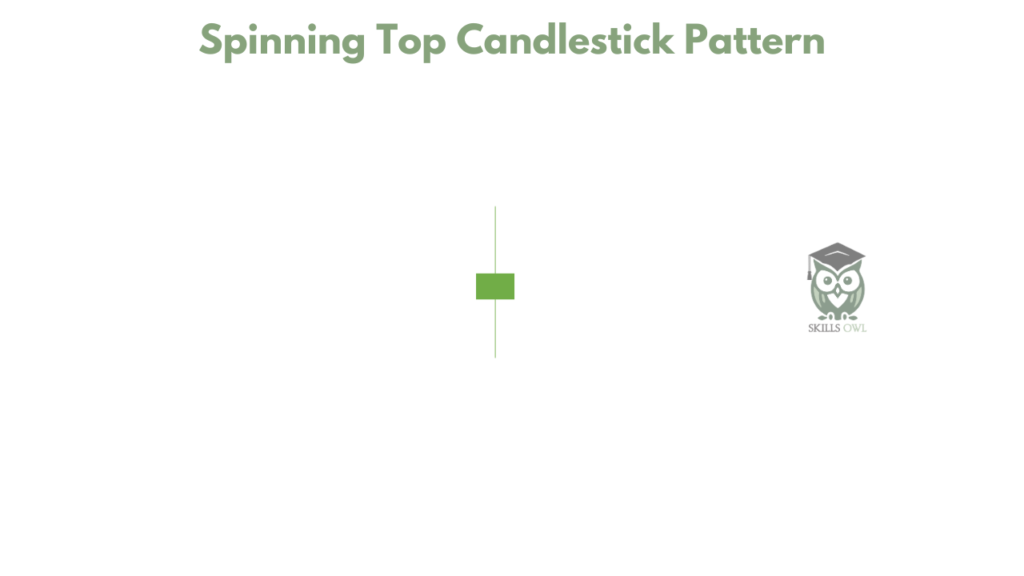
The Spinning Top candlestick pattern, similar to the Doji, signals indecision in the market. Differentiating between the two, the Spinning Top has a larger real body compared to the Doji in its formation.
Rising Three Methods
The Rising Three Methods is a bullish, five-candle continuation pattern indicating a pause in the current uptrend without signaling a reversal. This pattern consists of two long candlesticks aligned with the uptrend, with three shorter counter-trend candlesticks in between at the start and end.
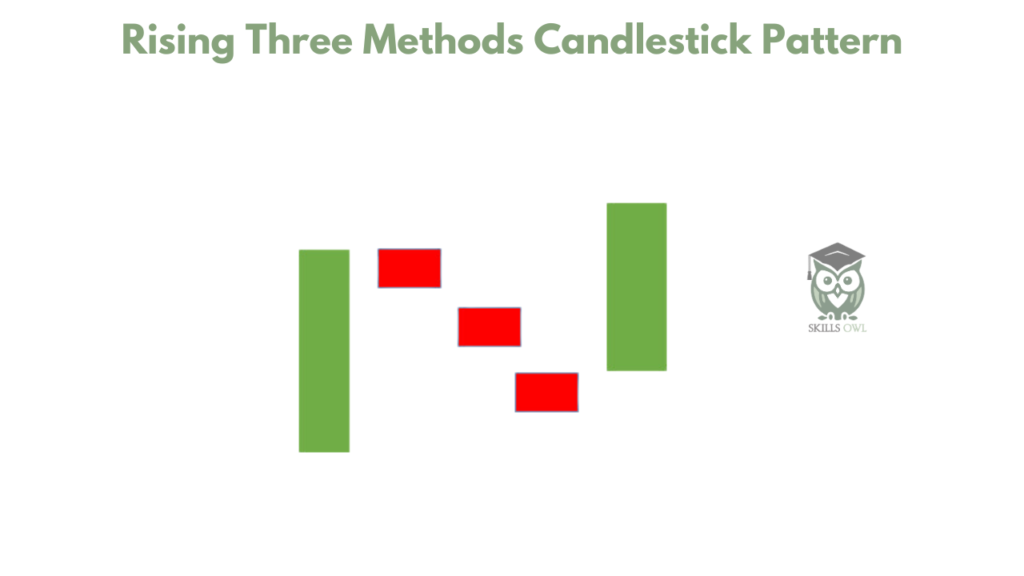
The candlestick pattern holds significance by indicating to traders that the bears lack sufficient strength to change the trend.
Falling Three Methods
The Falling Three method represents a bearish, five-candle continuation pattern indicating a temporary pause, rather than a complete reversal, in the current downtrend. This pattern consists of two extended candlesticks aligning with the downtrend at the start and end, accompanied by three shorter counter-trend candlesticks in between.
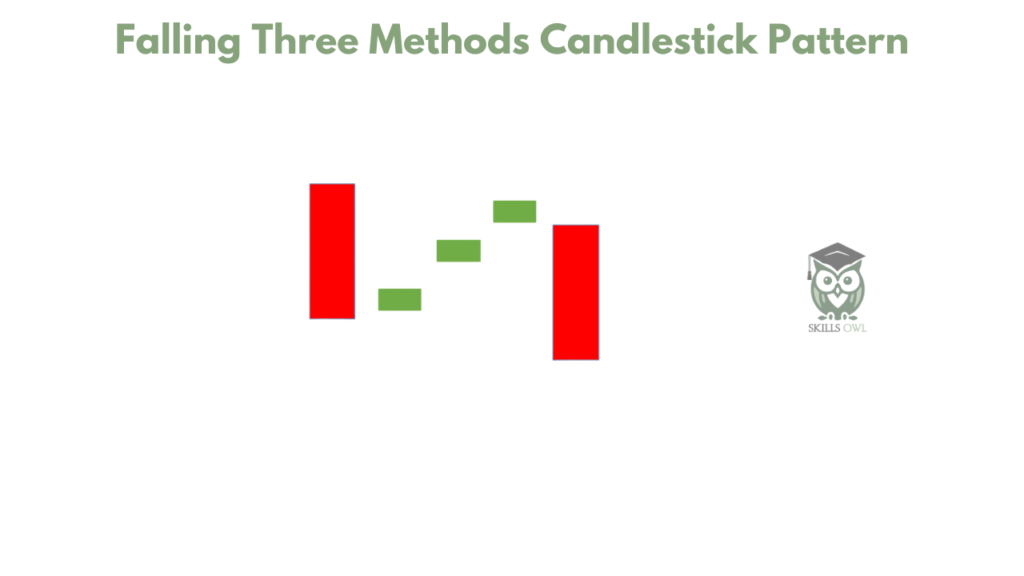
The candlestick pattern holds significance as it indicates to traders that the bulls lack sufficient strength to change the trend.
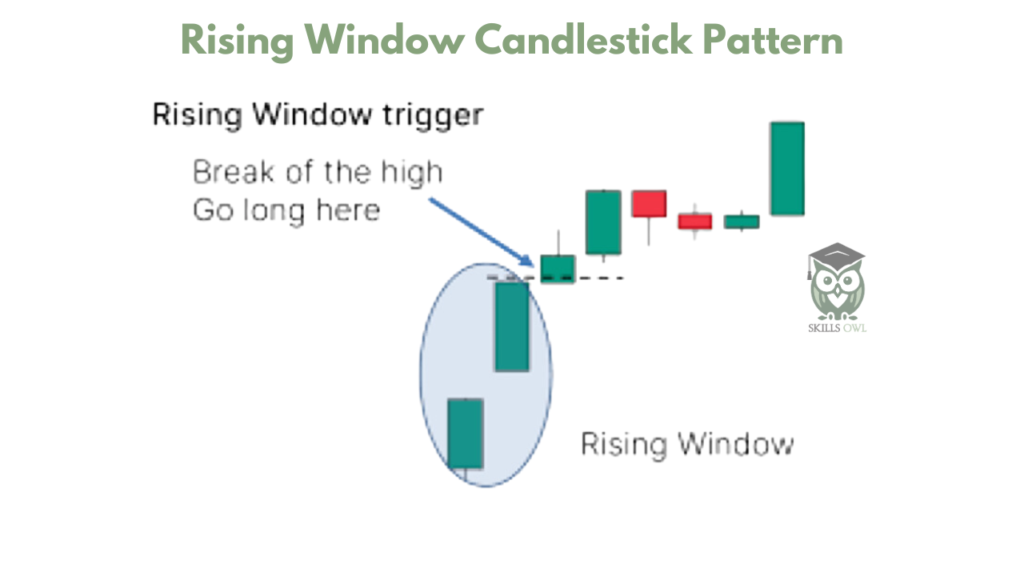
Rising Window
The Rising Window is a candlestick pattern comprised of two bullish candlesticks separated by a gap. This gap is created by the high trading volatility, leading to a space between the high and low of the two candlesticks. This pattern serves as a signal for market trend continuation, highlighting the robust presence of buyers in the market.
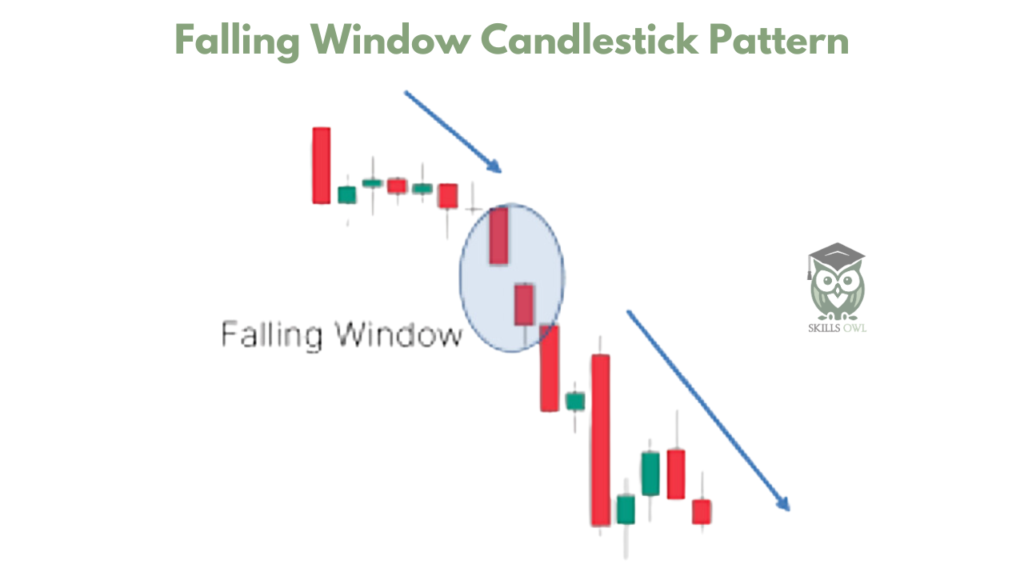
Falling Window
The Falling Window is a candlestick pattern comprising two bearish candlesticks separated by a gap. This gap represents the space between the high and low points of the two candlesticks and is typically caused by high trading volatility. This pattern signifies a continuation of the trend and indicates the considerable influence of sellers in the market.
Mat-Hold
A Mat Hold Pattern is a candlestick formation that signals the continuation of an ongoing trend. This pattern can be either bearish or bullish. A bullish scenario, it starts with a big bullish candle, followed by a gap up and three smaller candles that trend downwards.
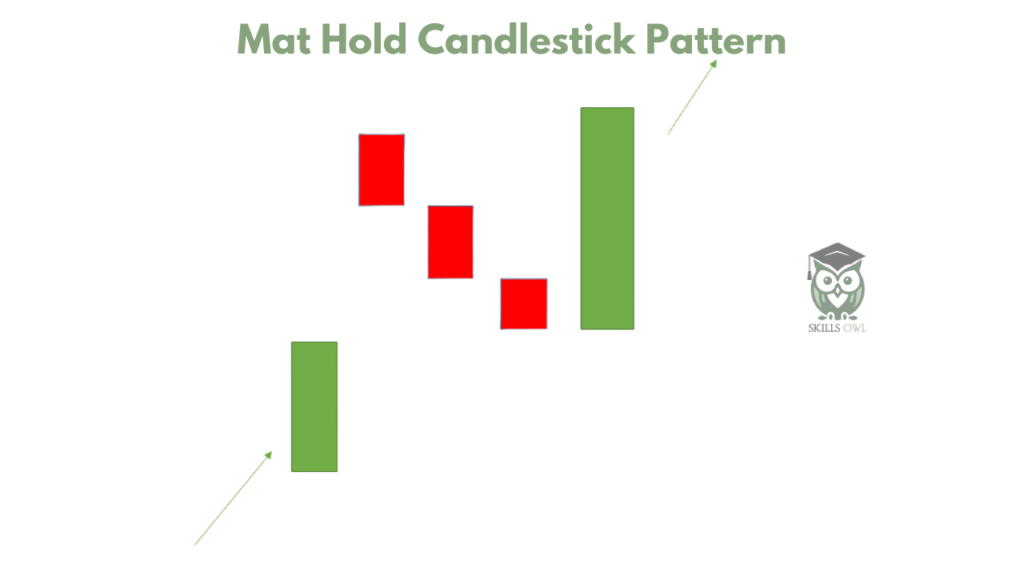
The candles need to remain above the low of the initial candle. The fifth candle is a significant upward-moving candle. This pattern emerges within an overall uptrend.
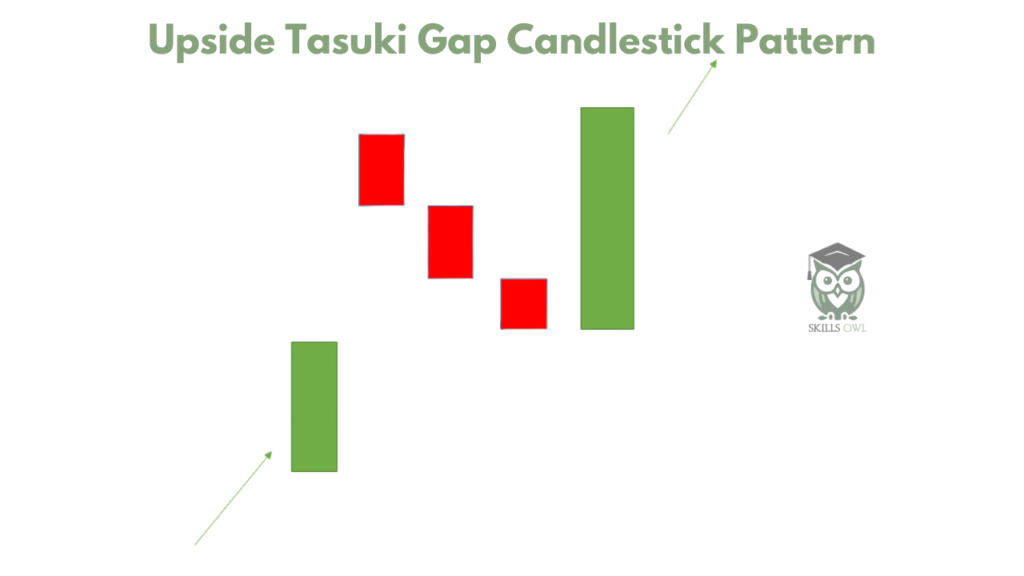
Upside Tasuki Gap
A Bullish Continuation Candlestick Pattern emerges within a continuing uptrend. This pattern involves three candles:
The first one is a long-bodied bullish candle, followed by a bullish candle created after a gap up. The third candle is a bearish one that ends within the gap formed by the first two bullish candles.
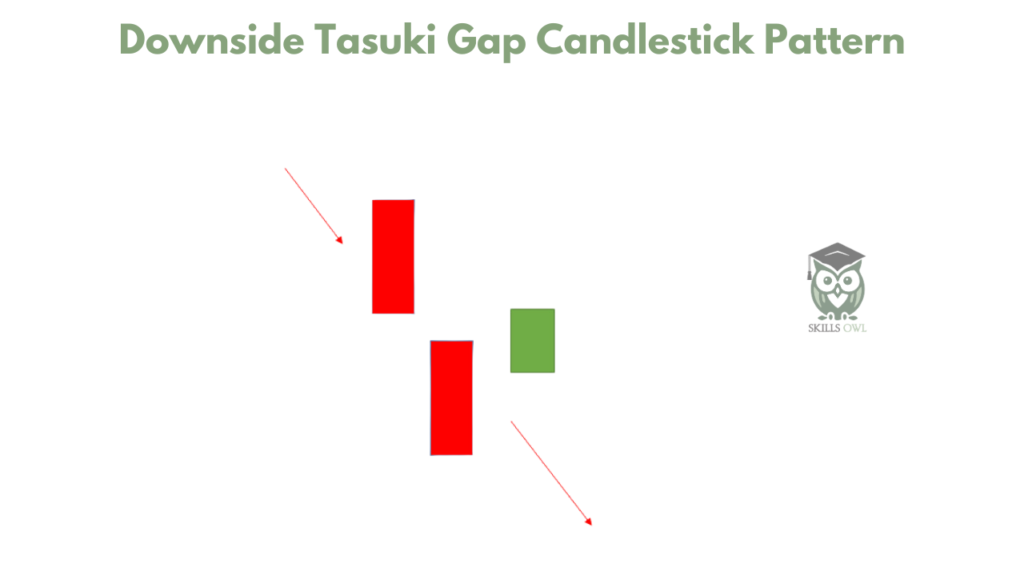
Downside Tasuki Gap
The Bearish Continuation Candlestick Pattern emerges within a downtrend. It comprises three candles.
- The first candle is a long-bodied bearish one.
- The second candle is another bearish one, created after a downward gap.
- The third candle, a bullish one, closes within the gap between the initial two bearish candles.
Conclusion
Reading a chart perfectly can lead you to immense wealth. There is a famous saying that makes charts your friends, as these friends will pay your bills forever, so choose your friends wisely.
If you are willing to learn more about Investing. You can also check our Trading category.

5 Most Powerful Bearish Candlestick Patterns - SkillsOwl
[…] reading about the basics of candlestick chart patterns, we will focus on Bearish candlestick patterns which usually indicate the end of an uptrend in the […]
5 Most Powerful Bullish Candlestick Patterns - SkillsOwl
[…] If you want to learn more about candlestick chart patterns you can read 35 Candlestick Patterns Every Traders Must Know. […]
10 Essential Insights into the Indian Stock Market for Wealth Creation - SkillsOwl
[…] Read More […]