Different Types of Candlestick Patterns in Stock Market
Originating in Japan in the 17th century, these candlestick patterns were first developed by a rice trader from Sakata, named Munehissa Homma. This innovative idea of using candlestick charts revolutionized the world of trading and provided a better way to represent price movements and market sentiments. This method became a hit, especially in the rice market, where the rice traders needed a way to quickly interpret the ebb and flow of prices.
The origins of candlestick patterns are indeed rooted in the history of Japanese rice trading but their application has now spread worldwide. These different types of candlestick patterns are now a foundation for technical analysis and are often used by traders and analysts, along with modern tools and technologies, helping them to interpret and predict market movements.
What are Candlestick Charts?
Candlestick charts are patterns that are used to predict future price movements. Each candlestick reveals the strength of either bulls or bears. They also provide a detailed overview of important things such as opening and closing prices, or the highest and lowest prices reached within a particular time.
Understanding candlestick chart patterns is essential as recognizing these patterns can help technical analysts to accurately predict future stock price trends.
How to read the different types of candlestick charts?
In day trading, a candlestick chart helps in understanding investor sentiments and the market dynamics along with the relation between supply and demand, bears and bulls, greed and fear, etc. Each candle provides valuable information but to understand the patterns, traders need to compare it with the candles before and after it.
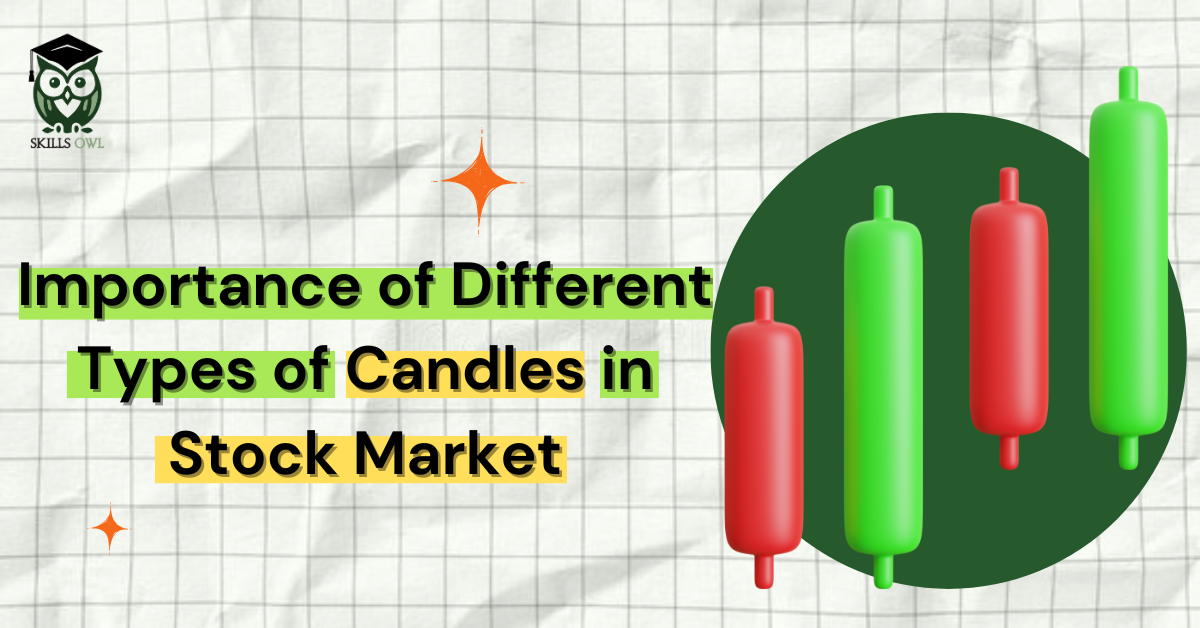
A candle represents the open, high, low, and close prices of a stock and has various components:
- The rectangular and wide part of the candle is called the ‘real body’ and shows a connection between the opening and closing prices. It represents the price range between the open and close price for the day.
- If a real body on the candlestick chart is filled with black or red colour, it indicates a bearish candle which means that the closing price was lower than the opening price.
- If a real body on the candlestick chart is empty with a white or green colour, it indicates a bullish candle which means that the closing price exceeded the opening price.
- There are thin vertical lines above and below the real body known as wicks or shadows, representing the highest and lowest prices. The upper shadow represents the highest price while the lower shadow shows the lowest price achieved during the trading season.
Different Types of Candlestick Patterns
There are three main categories of candlestick patterns.
1. Bullish Reversal Pattern
Bullish reversal candlestick patterns help traders and investors to earn profits from market reversals. These patterns indicate the possible end of a downtrend and the start of an uptrend. Following are some bullish reversal patterns:
- Hammer: A candlestick with a small real body, a long lower shadow, and little to no upper shadow.
- Piercing Line: A two-candle pattern includes a bearish candle, followed by a second candle that opens lower but closes over halfway up the first candle’s body.
- Morning Star: a three-candle pattern where the initial one is a lengthy barish candle, a small-bodied candle (either bearish or bullish) as the second, and a long bullish candle is the third.
2. Bearish Reversal Pattern
Traders can take the help of bearish candlestick patterns to recognize potential downtrends and protect their investments. These patterns indicate the possible reversals in an uptrend implying that selling pressure could exceed the buying pressure, which could lead to a price drop. Here is a list of some bearish reversal patterns:
- Hanging Man: A single candlestick with a small real body and a long lower shadow.
- Shooting Star: A single candlestick with a small body at the bottom and a long upper shadow.
- ̉Dark Cloud Cover: A two-candle pattern where the first candle is bullish, followed by a second candle that opens higher but closes below the midpoint of the first candle’s body.
3. Continuation Pattern
Continuation patterns are used in technical analysis and indicate a short pause in the current trend, whether upward or downward before it continues in its original direction. These patterns are crucial for traders who want to take advantage of the market momentum. Here are some common continuation patterns:
- Bear Flag: A rectangular pattern sloping downward emerges after a steep drop and looks like a flag.
- Cup and Handle: A bullish pattern that looks like a cup with a handle consisting of a rounded bottom forming the cup and a brief consolidation period representing the handle.
- Rectangle: A continuation pattern that occurs when the price fluctuates horizontally within defined support and resistance levels.
Frequently Asked Question
Candlestick patterns are visual depictions of price changes within a set timeframe. These patterns show the relationship between opening, closing, high and low prices.
One or more candles are displayed on a chart, where each candle contains a body indicating the price range between opening and closing prices along with wicks that represent the highest and lowest prices within the specified time frame.
Candlestick patterns help forecast market trends, but it is advised to not rely solely on them. Using these patterns along with other technical indicators like RSI or MACD, improves the accuracy significantly.
Candlestick patterns apply to intraday, daily, weekly, and monthly charts. The interpretation of these patterns remains the same but their reliability can differ based on the timeframe.
You can improve your skill by examining historical charts, integrating other technical analysis tools with candlestick patterns, and staying updated on market conditions.
